Spider Project is most functional and powerful professional project management software.
The first SP version was launched in 1993 and since then it has been constantly improved. Today is used in 34 countries though most Spider Project customers are in Russia. Spider Project offers numerous unique functional features and is the only PM software that optimizes resource, cost, and material constrained schedules and budgets for projects and portfolios.
The unique features of Spider Project include Quantity Based Scheduling, Conditional Scheduling, Skill Scheduling, Optimal Resource, Cost and Material Leveling, Resource Critical Path Calculation, Cash and Material Flows Calculation and Management, Trend Analysis, Advanced Risk Simulation and Analysis, Calculation of Success Probability Trends, Calculation and Management of required Project Time and Cost Buffers, Application of Corporate Norms, Management of many Parallel Budgets, Multiple WBS and many others.
Spider Project was and is used for management of many large scale programs in Russia, including $51bln construction program for 2014 Winter Olympic Games preparation.
The application areas where Spider Project is successfully used include Aerospace, Banking, Construction, Defense, Energy, Engineering, Infrastructure, Manufacturing, Metallurgy, Mining, Oil & Gas, Railways, Retail, Shipbuilding, Software Development, Telecommunications, Utilities, etc.
P6-Auditor - Display information from Primavera P6 audit tables in a user-friendly format
Unifier-Archiver - Extract and archive important documents and attachments from Primavera Unifier
Unifier-Loader - Load data into and out of Unifier via Excel
PCM-Loader - Import data into Primavera Contract Management with flexible and secure, template-driven Excel spreadsheets
PCM-Archiver - Extract and archive important documents and attachments from Primavera Contract Management
PCM-Unifier Migrator - Automatically transfer live and historical data from Primavera Contract Management to Primavera Unifier with ease
Create Radically Better Construction Schedules with ALICE Technologies
Use the power of AI to create construction schedules that reduce risk while cutting costs and build time. With ALICE, develop the ideal schedule during preconstruction -- or recover projects that are off schedule and over budget.
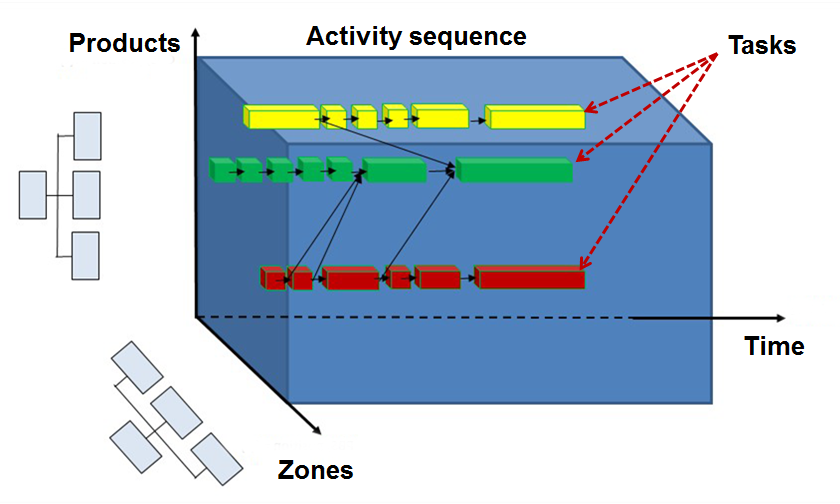
3D Gantt allows to see project interfaces, it is the add value, it is also a time location diagram, at the same time.
xhttp://3d-wbs.blogspot.fr/2013/01/part-58-3d-wbs-method-summary.html
[[wysiwyg_imageupload:1492:]]
This may be quite interesting however the application to normal projects alone makes it look like impractical. However, I would like to try it out.
This may be an interesting way to present a BAR Chart but the diagram absolutely no relationship to the production control charts developed by Henry Gantt. See: http://pmworldjournal.net/wp-content/uploads/2012/11/PMWJ5-Dec2012-WEAVER-Henry-Gantt-Debunking-Myths-Featured-Paper.pdf