Can we do layout in Primavera where we show spreadsheet view on top and underneath we show resource histogram
I try to create this in excel to give you clear pitcure of my question 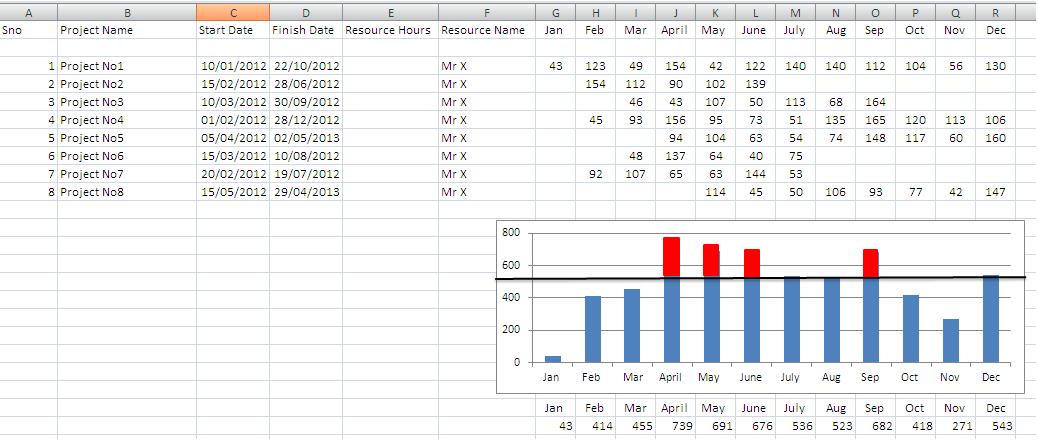
Can we do layout in Primavera where we show spreadsheet view on top and underneath we show resource histogram
I try to create this in excel to give you clear pitcure of my question
Note: Resource center 1 was defined to include all labor resources.
I do not expected for P6 reports be in the form of tables you can horizontal scroll, sort and filter before printing as you can in Excel and Spider Project Reports, this in most instances can eliminate the need for printing long reports from multiple report definitions. But I was hoping at least that by this time the limitation on financial periods was already solved. Hard to believe.
As a matter of fact many times our payment applications are dated a couple of days after end of month, this to include work like a big concrete pour that represents a large amount of money. We are not penalized because of a couple of days but our certifications represent legal documents that must be accurate. I remember having issues when required to model Payment Applications using old P3 and SureTrak, it was difficult for some inspectors to understand this flaw in these products that would change distributions because of unfinished activities from previous periods when your cutoff did not matched a pre-defined financial period. Of course the limitations on SureTrak were even worst.
I must be missing something as even Asta PP got it right, after you report some update the rate of progress remain fixed on reported periods and any new period can be updated with its own progress rate.
Financial periods is a logical way to do this but they may not be displayed in the Projects window.
If you wanted to create Financial Periods for each month and do period processing for each period this should be achievable, but I think it would be a bit of messing around. You would need to opem all the projects and in the activity view and sumerise at project level.
You could also create a User Definable field for each period and put the data against each value.
Maybe get a report written!
Paul E Harris
Director Eastwood Harris Pty Ltd
www.eh.com.au and www.eastwoodharris.com
www.primavera.com.au - this is a new Primavera Software resources web site.
Project Control Consultants and Planning and scheduling software book and training manual publishers
Financial periods is a logical way to do this but they may not be displayed in the Projects window.
If you wanted to create Financial Periods for each month and do period processing for each period this should be achievable, but I think it would be a bit of messing around. You would need to open all the projects and in the activity view and sumerise at project level.
You could also create a User Definable field for each period and put the data against each value.
Maybe get a report written!
Paul E Harris
Director Eastwood Harris Pty Ltd
www.eh.com.au and www.eastwoodharris.com
www.primavera.com.au - this is a new Primavera Software resources web site.
Project Control Consultants and Planning and scheduling software book and training manual publishers
I am not a P6 user but occurs to me maybe at the Bucket Planning View you can see the resource usage at the top and the histogram at the bottom.
Unless bucket planning respect rules of logic as implemented on your software it shall not be used for resource assignments per se.
In any case by creating a report template at a single click of the mouse you shall be able to get the table, at another click you shall be able to export it to Excel and there with another few clicks you will get your histogram.
click, click, click ...
<blink>still no reply from world leadingplanning platform</blink>
Please reply
No Possible Solution Yet
Thanks Sam did you try to print this out its not printing it just shows spreadsheet when i do the print preview
Any comment on it
[[wysiwyg_imageupload:850:]]
Hey John,
Try going to the "Tracking" area in P6.
You can manipulate the top area to Gantt, Spreadsheet or Resource Profile, and the bottom area should show the histogram.
You can select one or multiple projects in the left hand "Project" Display.
Hope that helps.
edit above ^^
No answer yet
No replies :(