Dear Sir
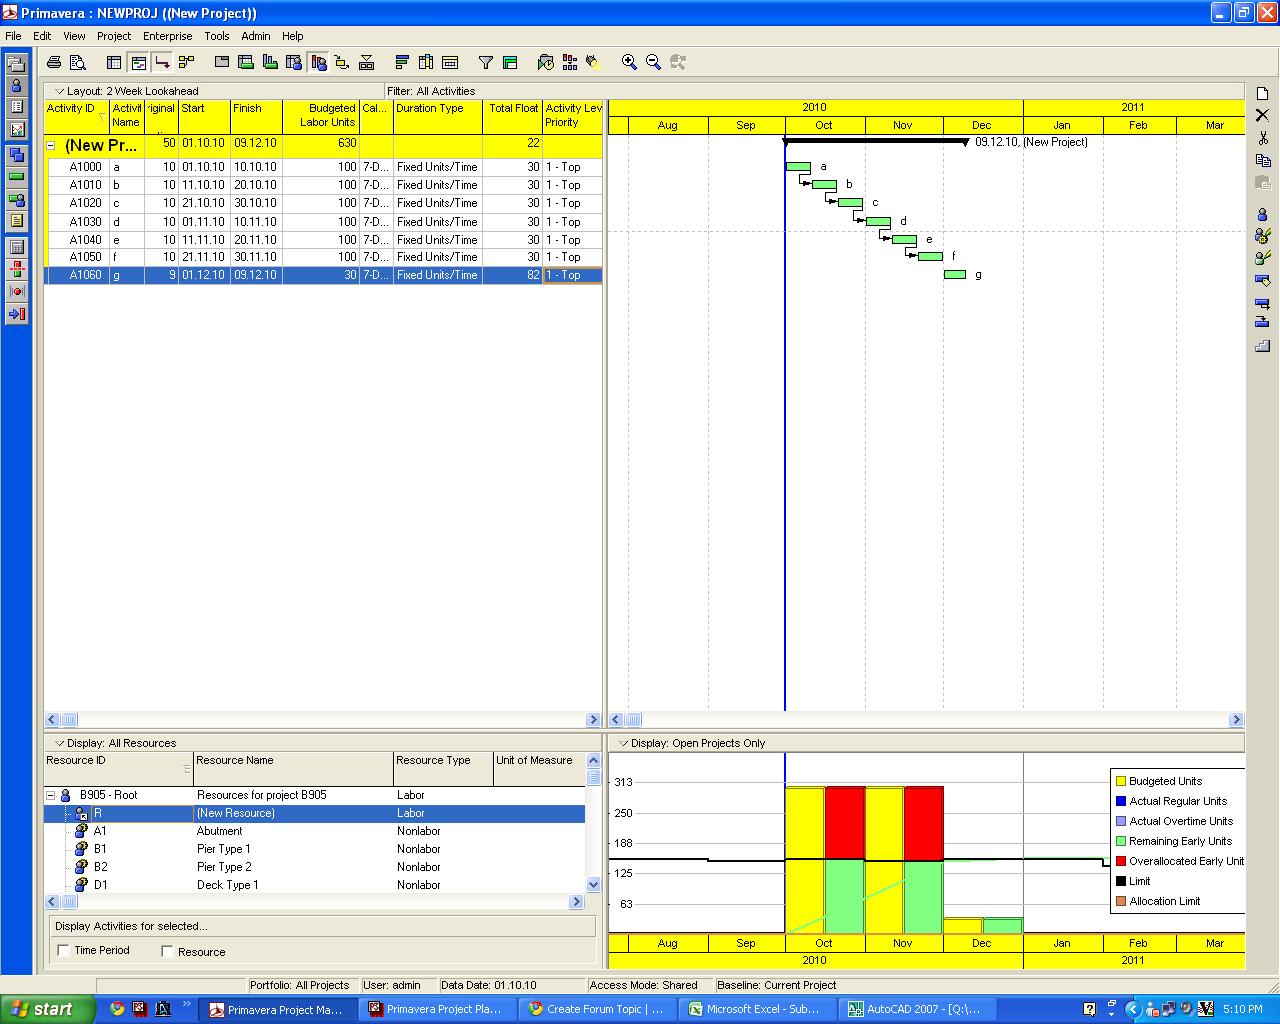
Attached is a graph generated after loading the resource.I want to show the planned and cumulative(left and right ) in Nos instead of d.Is there any way to show the numbers on top each monthly bars as same like generating in the excel.... Awaiting your reply
ARUN,
if your working hours per day is 10hrs then you divide it by 10 only....
calendar wil not matter.
cheers
Thank you Kumar
Friend help me for this one also
Please define me about this average .....
My program is a 6 day calendor with 10 hrs working time .How much I have to put as Average ?????
Dear Arun,
here is the option.
go to the reosurce usage profile then right click in the graph.there you will find the options for DATA and GRAPH.
then in the graph there is a option for calculate average click it,here you have to divide the intervals by either 12hrs(shift wise) or 24hrs(day wise) based on the usage of your resources.you can mention N in the unit of measure.
Regarding Numbering each bar is not possible and still have to wait.you can use the excel sheet for better presentation.
cheers
Any way to change the d units I want the manpower in numbers ....
How to export the units to excel
none that i know...
the thing is, the curve that P6 can produce is pretty limited and if you want to have more flexibilities, you have to use external tools such as excel, access, etc.
i would also be glad to know if what you are asking is possible.
I think it is impossible, Primavera only provided two options: day and cost.
Normally I use Excel to make the S curve more flexiable. Input and maintain resources in Primavera is a difficult work, especially in a complicated project with very many activites.