If you have clients in different countries working for different companies you might need to report for many different fiscal years, in some countries it might be starting in the middle of a month. It should not be a big deal, is a no brainer; different clients, different fiscal year, different accounting codes, different WBS ... By the same token if you update the schedule on a weekly basis the start/end of the weeks most probably will not fall at start/end of the month you should still be able to make correct monthly reports using monthy periods as well as if using any period of your choice.
Not sure what's the real issue is. Is it the report Gantt chart or the Gantt chart view at the layout? Can you share the snapshot of what you wanted to attain?
Doesn't seem to work the way we all think. Dumped all the previous timeperiods, dumped all projects that do not have a July 1st Financial Period Start, refreshed, but still the Gantt Chart shows running January (1) to December (12) with Current Mont, August as 8
Spider Project is most functional and powerful professional project management software.
The first SP version was launched in 1993 and since then it has been constantly improved. Today is used in 34 countries though most Spider Project customers are in Russia. Spider Project offers numerous unique functional features and is the only PM software that optimizes resource, cost, and material constrained schedules and budgets for projects and portfolios.
The unique features of Spider Project include Quantity Based Scheduling, Conditional Scheduling, Skill Scheduling, Optimal Resource, Cost and Material Leveling, Resource Critical Path Calculation, Cash and Material Flows Calculation and Management, Trend Analysis, Advanced Risk Simulation and Analysis, Calculation of Success Probability Trends, Calculation and Management of required Project Time and Cost Buffers, Application of Corporate Norms, Management of many Parallel Budgets, Multiple WBS and many others.
Spider Project was and is used for management of many large scale programs in Russia, including $51bln construction program for 2014 Winter Olympic Games preparation.
The application areas where Spider Project is successfully used include Aerospace, Banking, Construction, Defense, Energy, Engineering, Infrastructure, Manufacturing, Metallurgy, Mining, Oil & Gas, Railways, Retail, Shipbuilding, Software Development, Telecommunications, Utilities, etc.
P6-Auditor - Display information from Primavera P6 audit tables in a user-friendly format
Unifier-Archiver - Extract and archive important documents and attachments from Primavera Unifier
Unifier-Loader - Load data into and out of Unifier via Excel
PCM-Loader - Import data into Primavera Contract Management with flexible and secure, template-driven Excel spreadsheets
PCM-Archiver - Extract and archive important documents and attachments from Primavera Contract Management
PCM-Unifier Migrator - Automatically transfer live and historical data from Primavera Contract Management to Primavera Unifier with ease
Create Radically Better Construction Schedules with ALICE Technologies
Use the power of AI to create construction schedules that reduce risk while cutting costs and build time. With ALICE, develop the ideal schedule during preconstruction -- or recover projects that are off schedule and over budget.
Different Countries - Different Financial years - Tax Ninja | Serving Knowledge Digitally
What is a fiscal year? | AccountingCoach
Hi Rod,
Go to Project Window and select Settings Tab. Under Project Settings, change the Fiscal year begins on the 1st day of : to "July"
Hi Rodel,
As you can see, The Fiscal year is starting in January, I need it to start in July. CM is August which should be FM2
Hi Rod,
Not sure what's the real issue is. Is it the report Gantt chart or the Gantt chart view at the layout? Can you share the snapshot of what you wanted to attain?
Doesn't seem to work the way we all think. Dumped all the previous timeperiods, dumped all projects that do not have a July 1st Financial Period Start, refreshed, but still the Gantt Chart shows running January (1) to December (12) with Current Mont, August as 8
Admin
Financial Periods
Add then you can make it monthly intervals if you are updating on a monthly basis
this will let you use store period performance
Hi Rodney,
You have to define a financial year that start 1st July and use that as timescale.
See below steps:
Step 1: Create a Financial Year batch starting 1stJuly (depends on how many years you want to create)
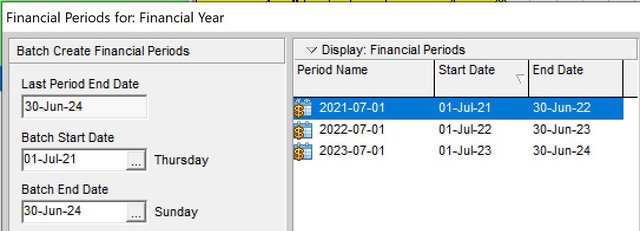
Step 2: Change your timescale to Financial Year that you created

See result:
