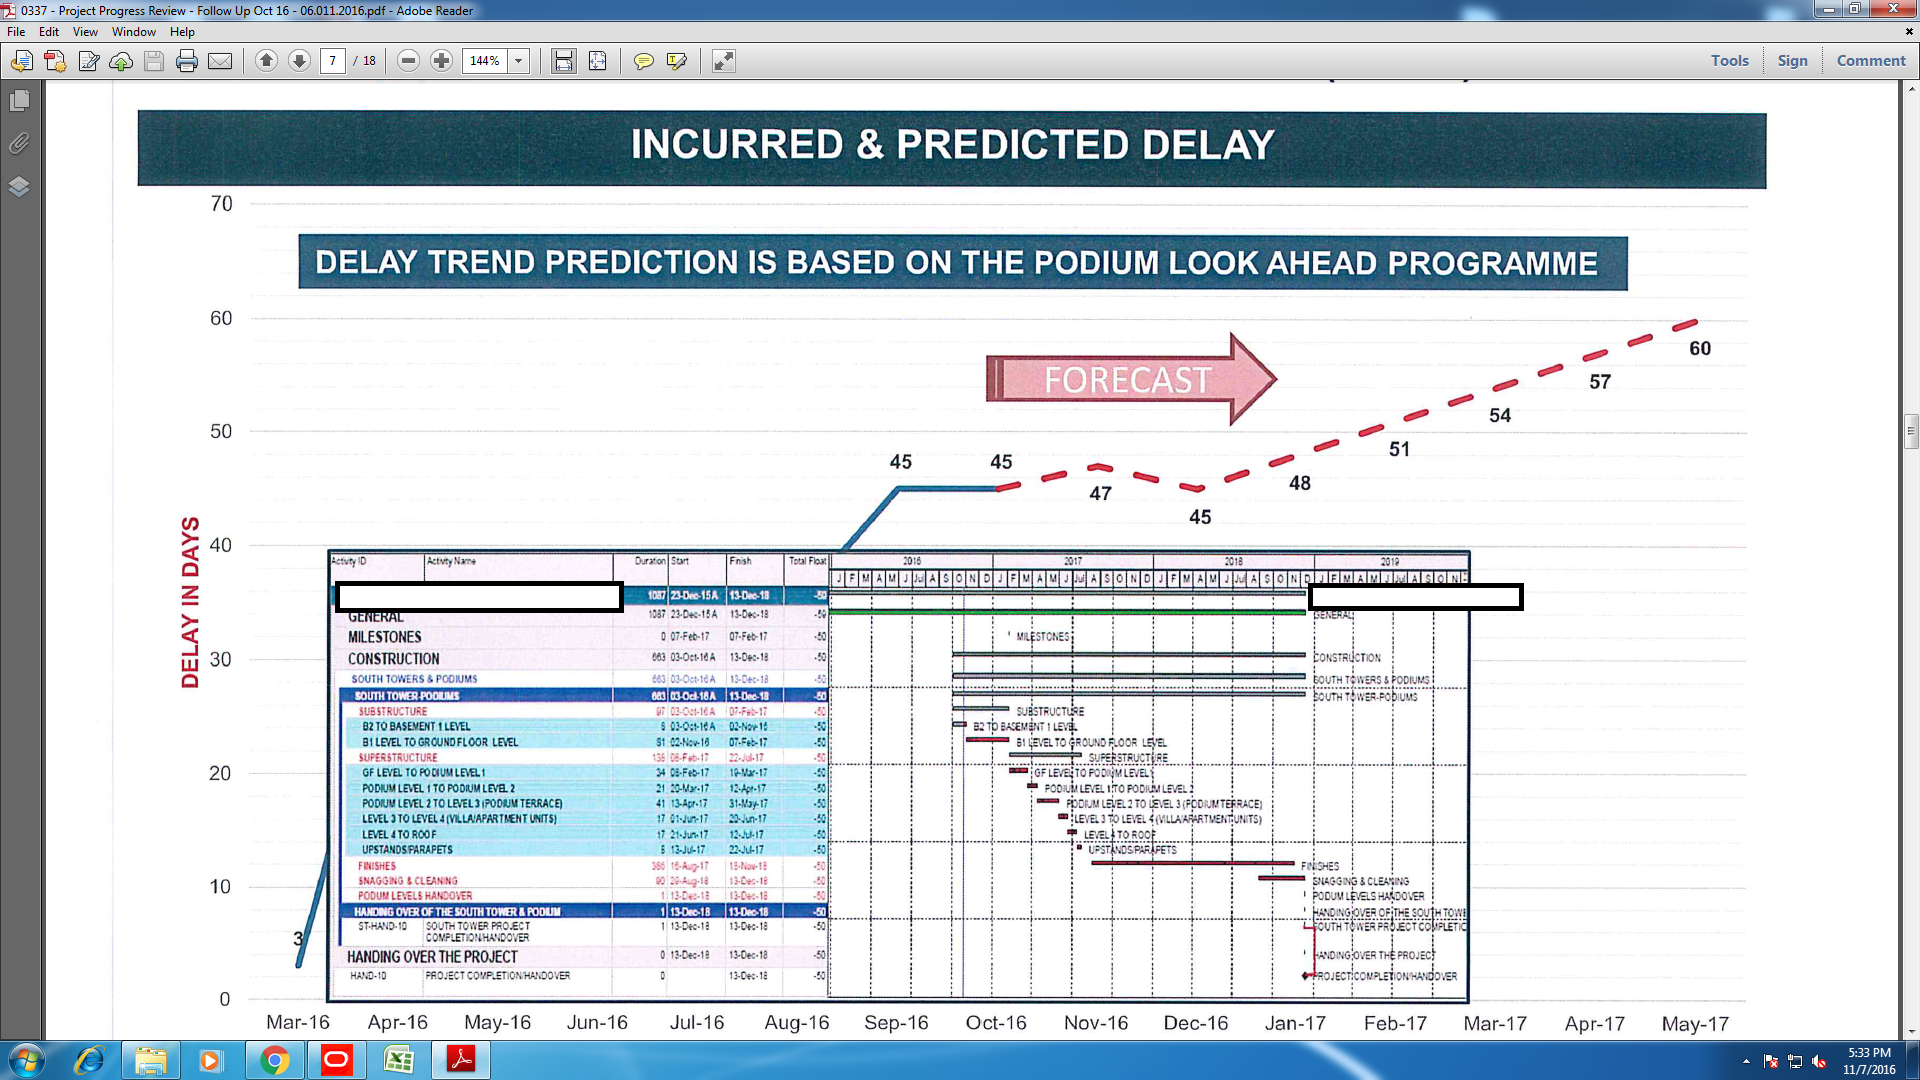
Our PMC in the monthly presentation showed us this FORECASTED Delay by his trend curve.
Can Anyone help and please tell me how he prepares the Delay Trend Curve ?
Our PMC in the monthly presentation showed us this FORECASTED Delay by his trend curve.
Can Anyone help and please tell me how he prepares the Delay Trend Curve ?
A schedule that yields such a report shall be rejected and required to be revised as such DUMMY projections report says you have a plan that will not meet contractual conditions in the future.
The disclosed variances for every period each represent the projected value at each update. In this case the projected duration variance during each month. The projections for each future period are projections of the projected variance, which does not make much sense. To say "if such trends continue ... is too much of an hypothetical statement. The author of the chart is essentially saying current projection is wrong as well as any future projection.
this looks like it was done in excel with the schedule pasted into the spreadsheet. It look like uses the number of activities in planned to happen it looks to be a liner projection losing 3 day per month starting in December 2016. I guess the theory is that if you are not doing anything to improve the schedule and just maintain status quo then the schedule will consistently be delayed the same amount of time each month (3 days).
if you have quantiites assoicated with this activites this will give a rate of installation.