08.0 - MANAGING COST ESTIMATING & BUDGETING
08.1 - Module 08-1 - Introduction to Managing Cost Estimating & Budgeting
08.2 - Module 08-2 - Develop Cost Estimating & Budgeting Policies & Procedures Manual
08.3 - Module 08-3 - Define The Estimates Purpose And Scope Of Work (Owner)
08.4 - Module 08-4 - Creating the Owners Cost Estimate (Top Down)
08.5 - Module 08-5 - Define the Estimates Purpose and Interpret the Scope of Work (Contractor)
08.6 - Module 08-6 - Developing the Contractors Cost Estimate (Bottom Up)
08.7 - MODULE 08-7 - VALIDATE THE TIME & COST TRADE OFFS
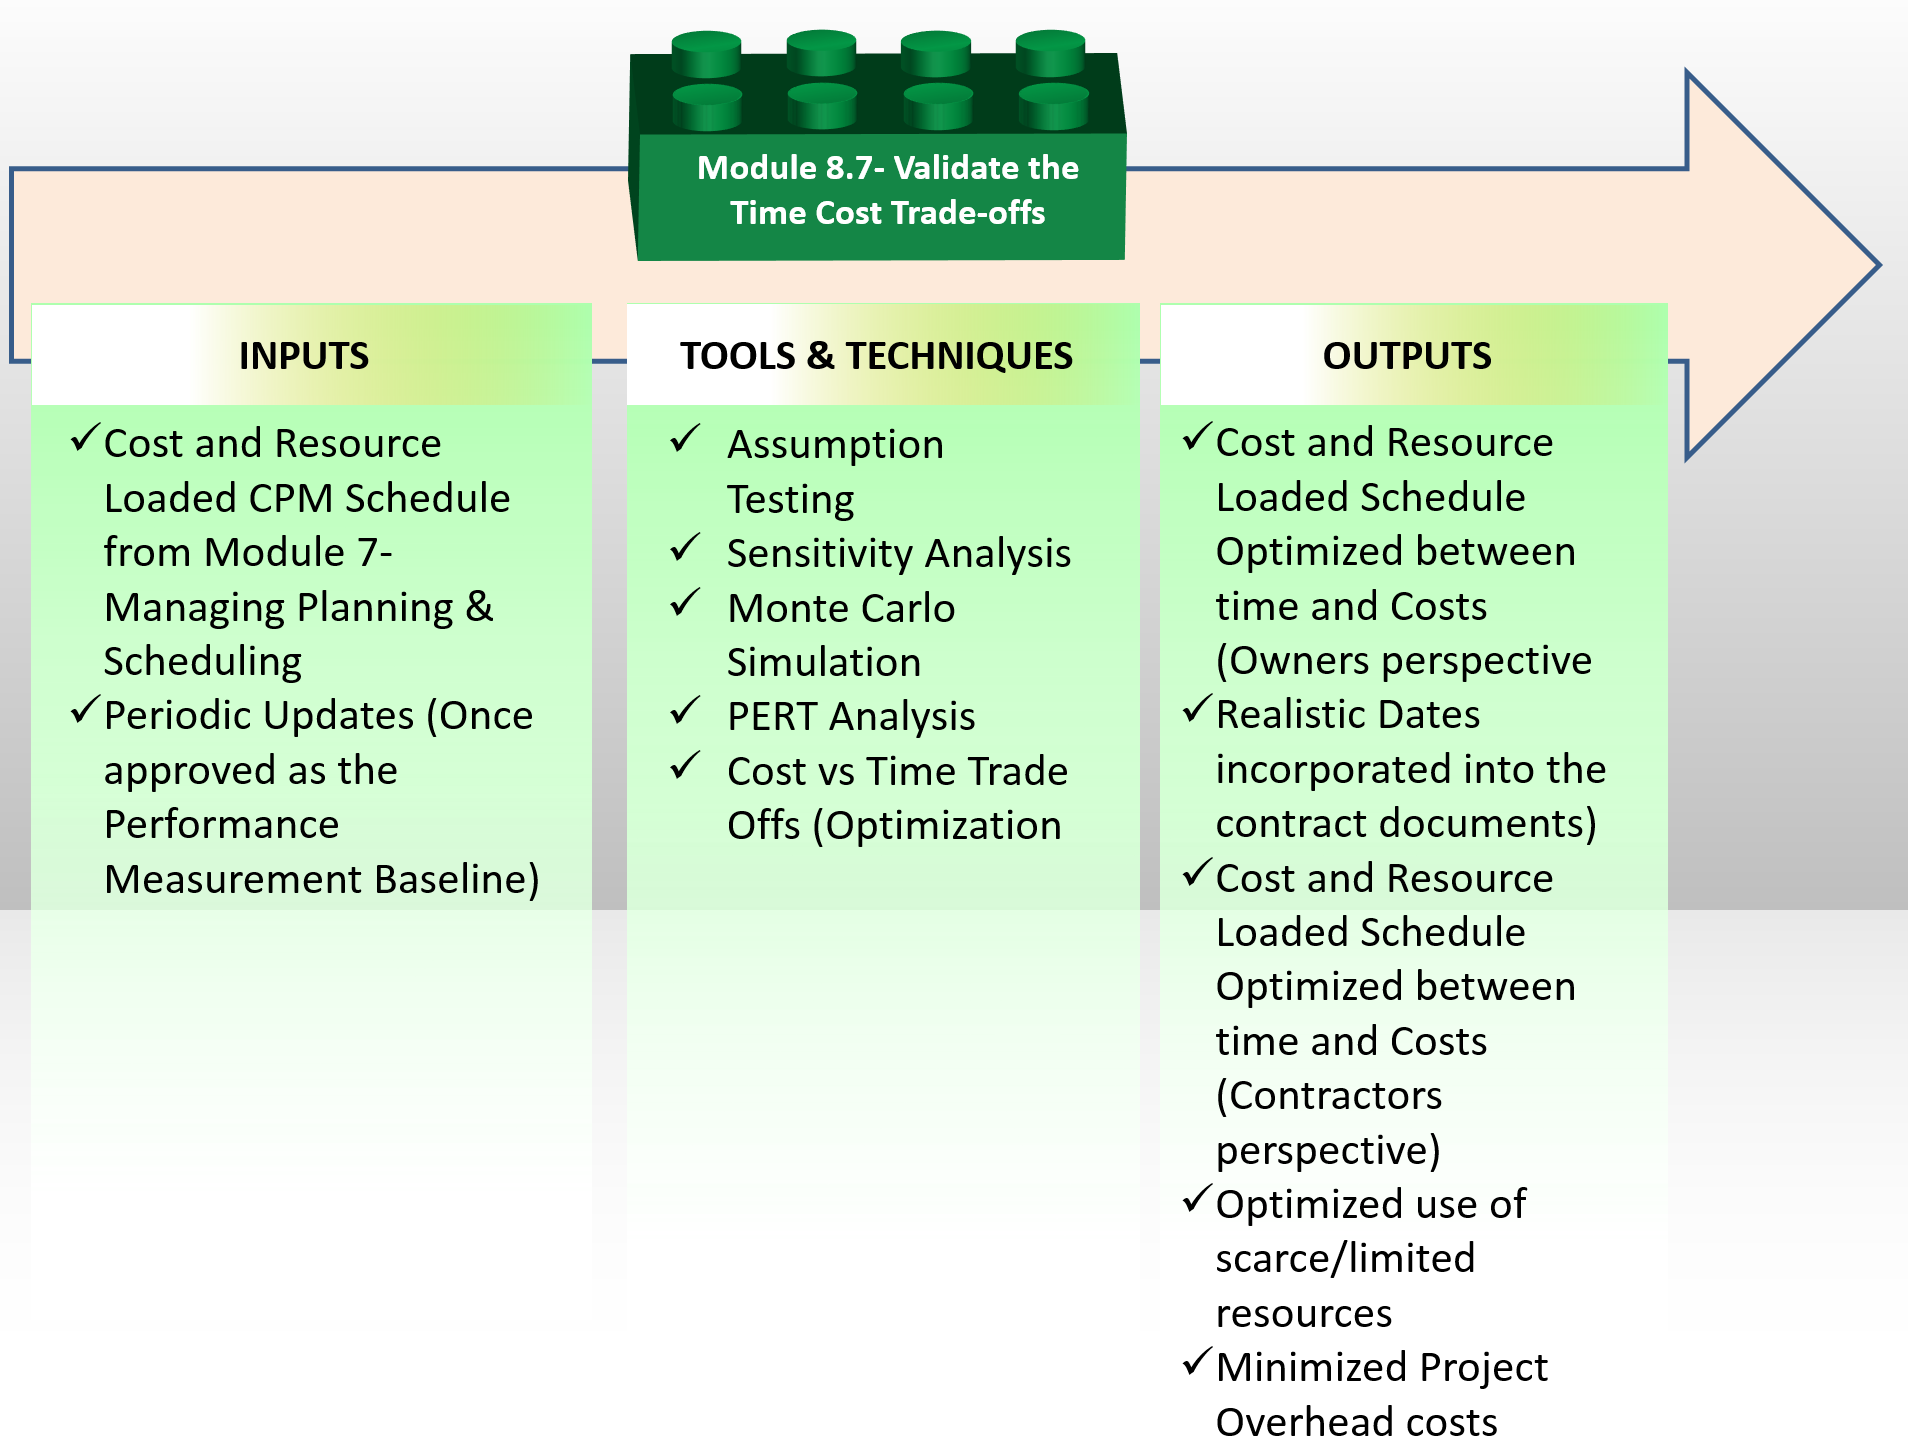
Figure 1 - Validate the Time & Cost Trade Offs Process Map
Source: Guild of Project Controls
08.7.1 INTRODUCTION
The Validate the Time Cost Trade-offs:
This is a quality control function that should be performed by the CONTRACTOR’s Project Control Team:
- PRIOR to submitting the cost and resource loaded schedule to the owner for acceptance as the performance measurement baseline;
- PRIOR to submitting each and every required update
- PRIOR to submitting any “ad hoc” or “special request” updates or analysis either to the owner or to the contractors own management team.
This is also a quality control function that should be performed by the OWNER’s Project Control Team:
- AFTER the contractor has submitted their cost and resource loaded schedule for acceptance by the owner as the performance measurement baseline but BEFORE you make your recommendations to your (OWNER) management to accept the Contractors cost and resource loaded schedule as the PMB “as submitted” or do you recommend changes be made to it?
- AFTER the CONTRACTOR submits each and every REQUIRED update but BEFORE you make your recommendations to your (OWNER) management to accept the Contractors update “as submitted” or do you recommend changes be made to it, including REBASELINING or creating a RECOVERY schedule?
- AFTER the CONTRACTOR submits each and every “Ad Hoc” or “special request” update but BEFORE you make your recommendations to your (OWNER) management to accept the Contractors update “as submitted” or do you recommend changes be made to it, including REBASELINING or creating a RECOVERY schedule?
This module is the first of a series of QUALITY CONTROL checks that both OWNERS and CONTRACTORS project control teams should be conducting on the cost and resource loaded CPM schedule, first on the original baseline schedule before it is submitted to the owner by the contractor and then by the owner’s project control team prior to acceptance as the Performance Measurement Baseline and then again by both contractors and owner’s project control team on each and every subsequent update. Refer back to Figure XX Showing the Interfaces between Contractor and Owner for Modules 7 - Managing Planning & Scheduling, Module 8- Managing Cost Estimating and Budgeting and Module 9- Managing Project Progress to understand this process.
For those preparing for any level of the GPC Certifications for the Planning and Scheduling, Cost Management or Project Controls Track you need to remember that the Guild has incorporated by reference the The US Government Accountability Office (GAO) “Cost Estimating and Assessment Guide- Best Practices for Developing and Managing Capital Program Costs” (2009) GAO-09-3SP , Appendix I and Appendix III and GAO Cost Estimating and Assessment Guide Best Practices for Developing and Managing Capital Program Costs “Best Practices Checklist” #1-#17.
08.7.2 INPUTS
- Cost And Resource Loaded CPM Schedule From Modules 7 - Managing Planning & Scheduling
- Periodic Updates (Once Approved as the Performance Measurement Baseline)
08.7.3 TOOLS & TECHNIQUES
08.7.3.1 Assumption Testing
Assumption Testing is “a project management exercise that requires planners, schedulers, cost estimators and project control practitioners to identify all assumptions being made in the project planning stage as a means of risk reduction. Each assumption is then analyzed to determine its accuracy and to identify all potential project risks if the assumption if later found to be inaccurate. Especially in the early phases of the cost estimate and budgeting process, much of the information being provided to the cost estimator are ASSUMPTIONS.
Assumptions are also known a Hypothesis and in order to be validated or corroborated, we need to test or challenge them.
This is known as “assumption busting” which is defined to be “An advanced brainstorming technique that works by challenging assumptions that have gone un-debated". Key assumptions are identified and their accuracy mercilessly questioned. Alternative new assumptions are formed and then tested by asking 'what if' questions. "Assumption Busting” lies at the very heart of “critical thinking” skills, innovation and being able to “think outside the box” which according to most research is exactly what organizations are seeking, ESPECIALLY in their project managers and project support teams.
Here are additional references to learn how to actually apply Assumption Testing
- Statistica (2015) http://www.statistica.com.au/more_statistics.html
- Quant Concepts (2010) https://www.youtube.com/watch?v=UApFKiK4Hi8
- Ko, Konan (2011) https://www.youtube.com/watch?v=2gVIgw9NYZo
08.7.3.2 Sensitivity Analysis
Our Business Dictionary definition of “Sensitivity Analysis” is a “Simulation analysis in which key quantitative assumptions and computations (underlying a decision, estimate, or project) are changed systematically to assess their effect on the final outcome. Employed commonly in evaluation of the overall risk or in identification of critical factors, it attempts to predict alternative outcomes of the same course of action. In comparison, contingency analysis uses qualitative assumptions to paint different scenarios. Also called what-if analysis."
And a “Sensitivity Chart” to be a “Graph that plots the results of various assumption on the final outcome in a sensitivity analysis exercise. Also called tornado diagram or “Spider Charts”.
In the two examples below, we can see the same case study, plotted using both the Tornado Diagram and Spider Chart views.
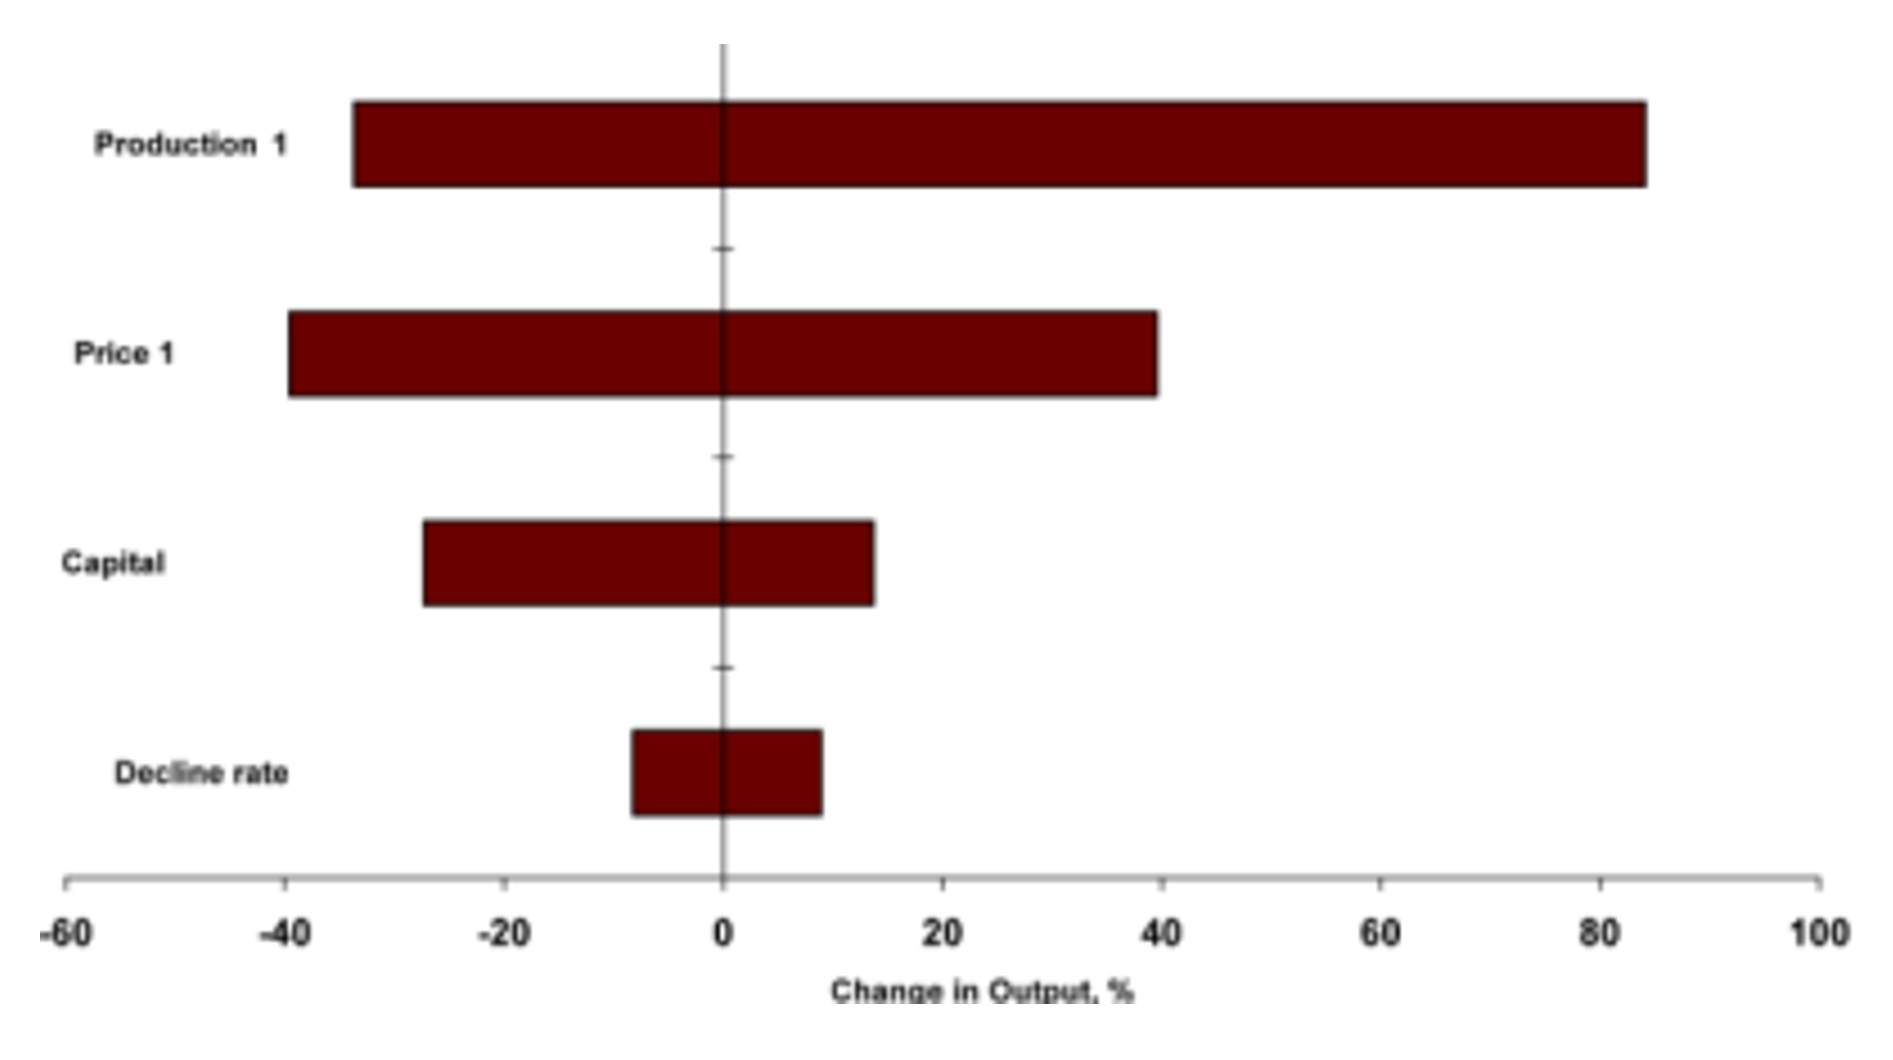
Figure 2 - Tornado Diagram
Source: @Risk for Projects Online Users Manual Tutorials
The first graph (Figure 2) is an example of a “Tornado Diagram” common to oil and gas, which compares the various financial elements which have an impact on the NPV of a project.
As you can see, the rate of production from a well or field has the most impact, both positive and negative, while the price of oil in number two position doesn’t have as much variability on the up or positive side but can have a greater impact on the down side. Likewise the cost of capital in third position has more potential to negatively impact the NPV than it does positively and the rate of decline as the least impact, either positively or negatively.
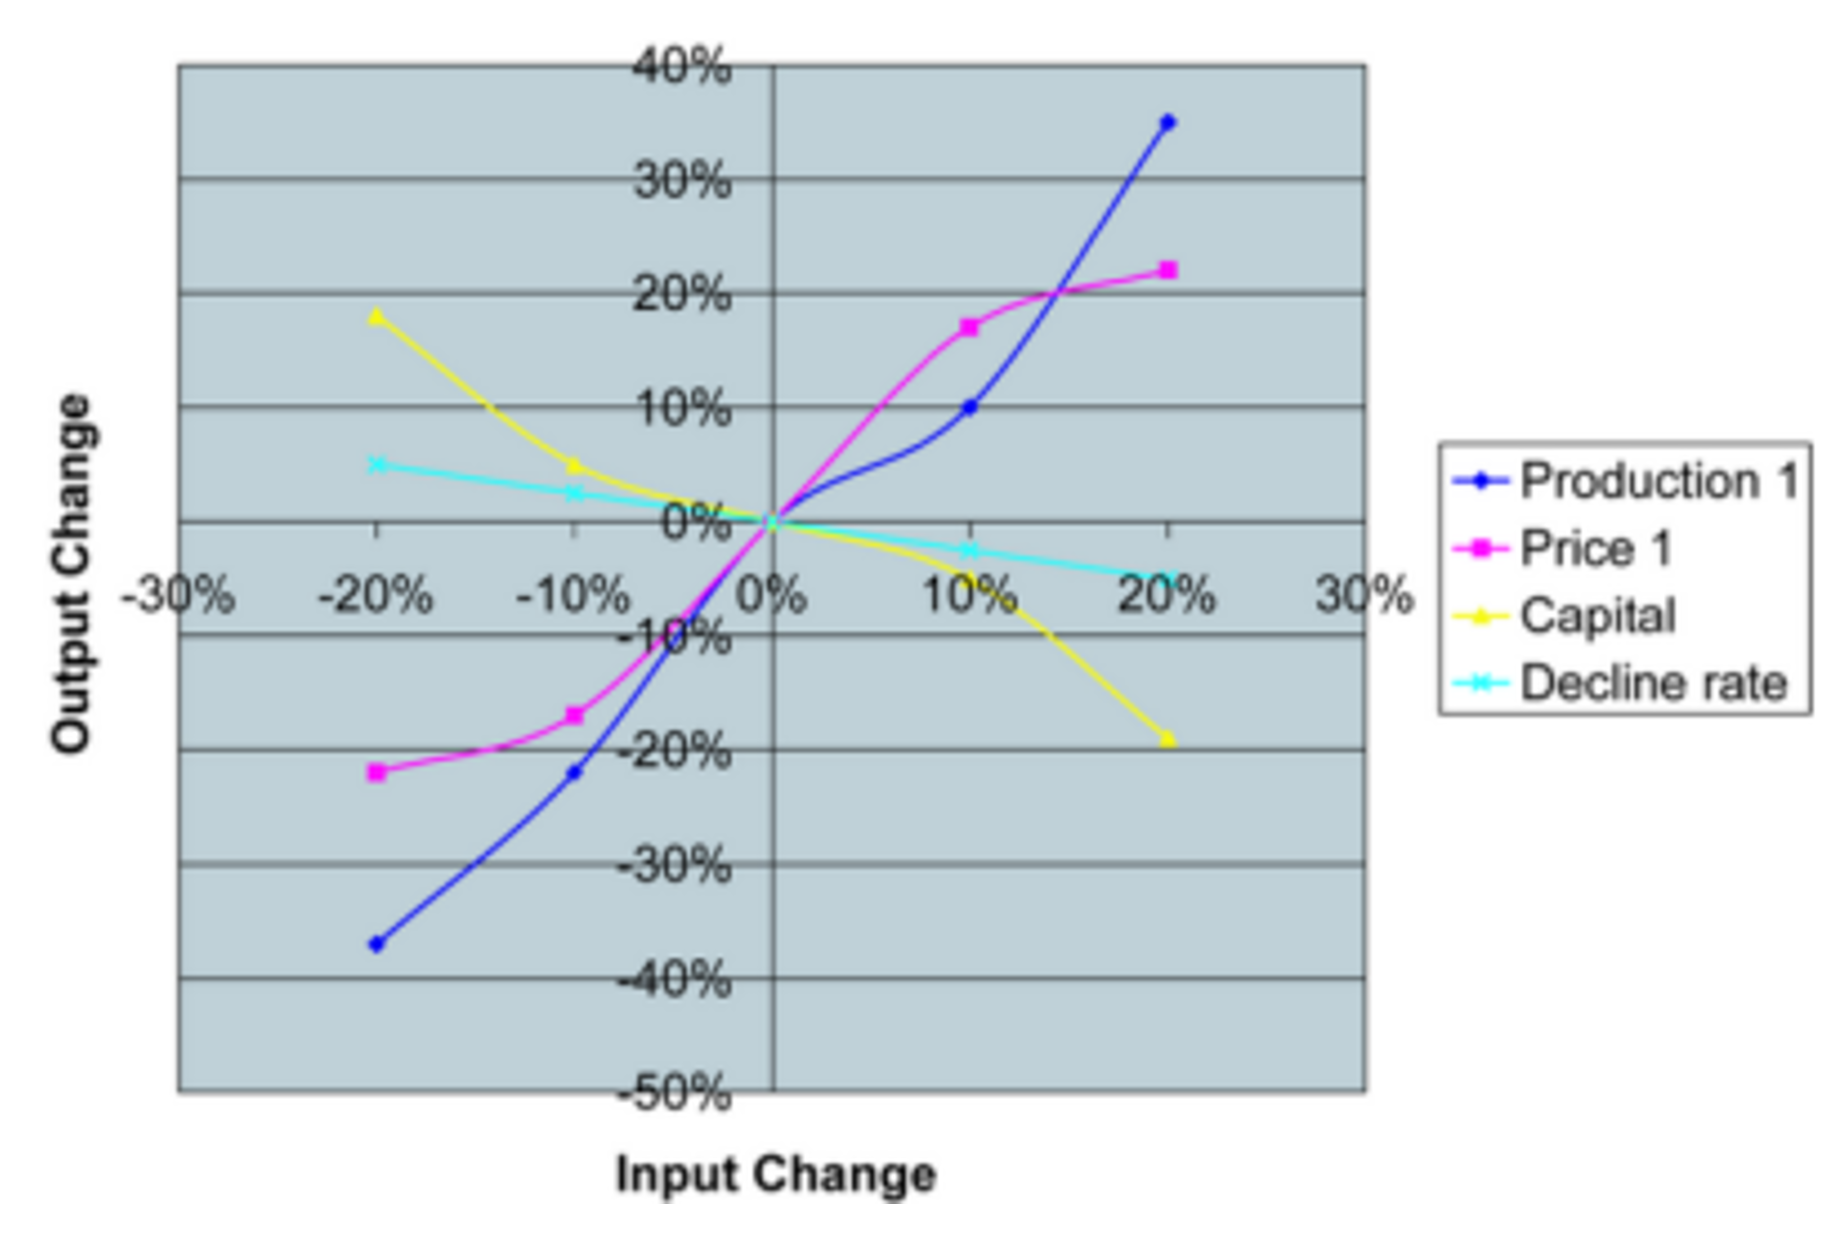
Figure 3 - Spider Graph
Source: @Risk for Projects Online Users Manual Tutorials
The second graph (Figure 3) is showing exactly the same data, but instead of being presented as a Tornado Diagram, we see it as a Spider Graph. When viewing a Spider Graph, the steeper the line, the more severe the impact while the shallower or flatter the line, the less impact.
Most simulation packages such as @Risk can generate both these graphics, depending on how you want to present the data. Generally speaking, management seems to prefer Tornado Diagrams over Spider Charts, although as you can see from the example above, the Spider Chart provides a better picture of how the data is allocated.
08.7.3.3 Monte Carlo Simulation
This is the same software we used to generate our risk analysis in Module 4 - Managing Risk & Opportunity, but now instead of simulating time we are simulating money.
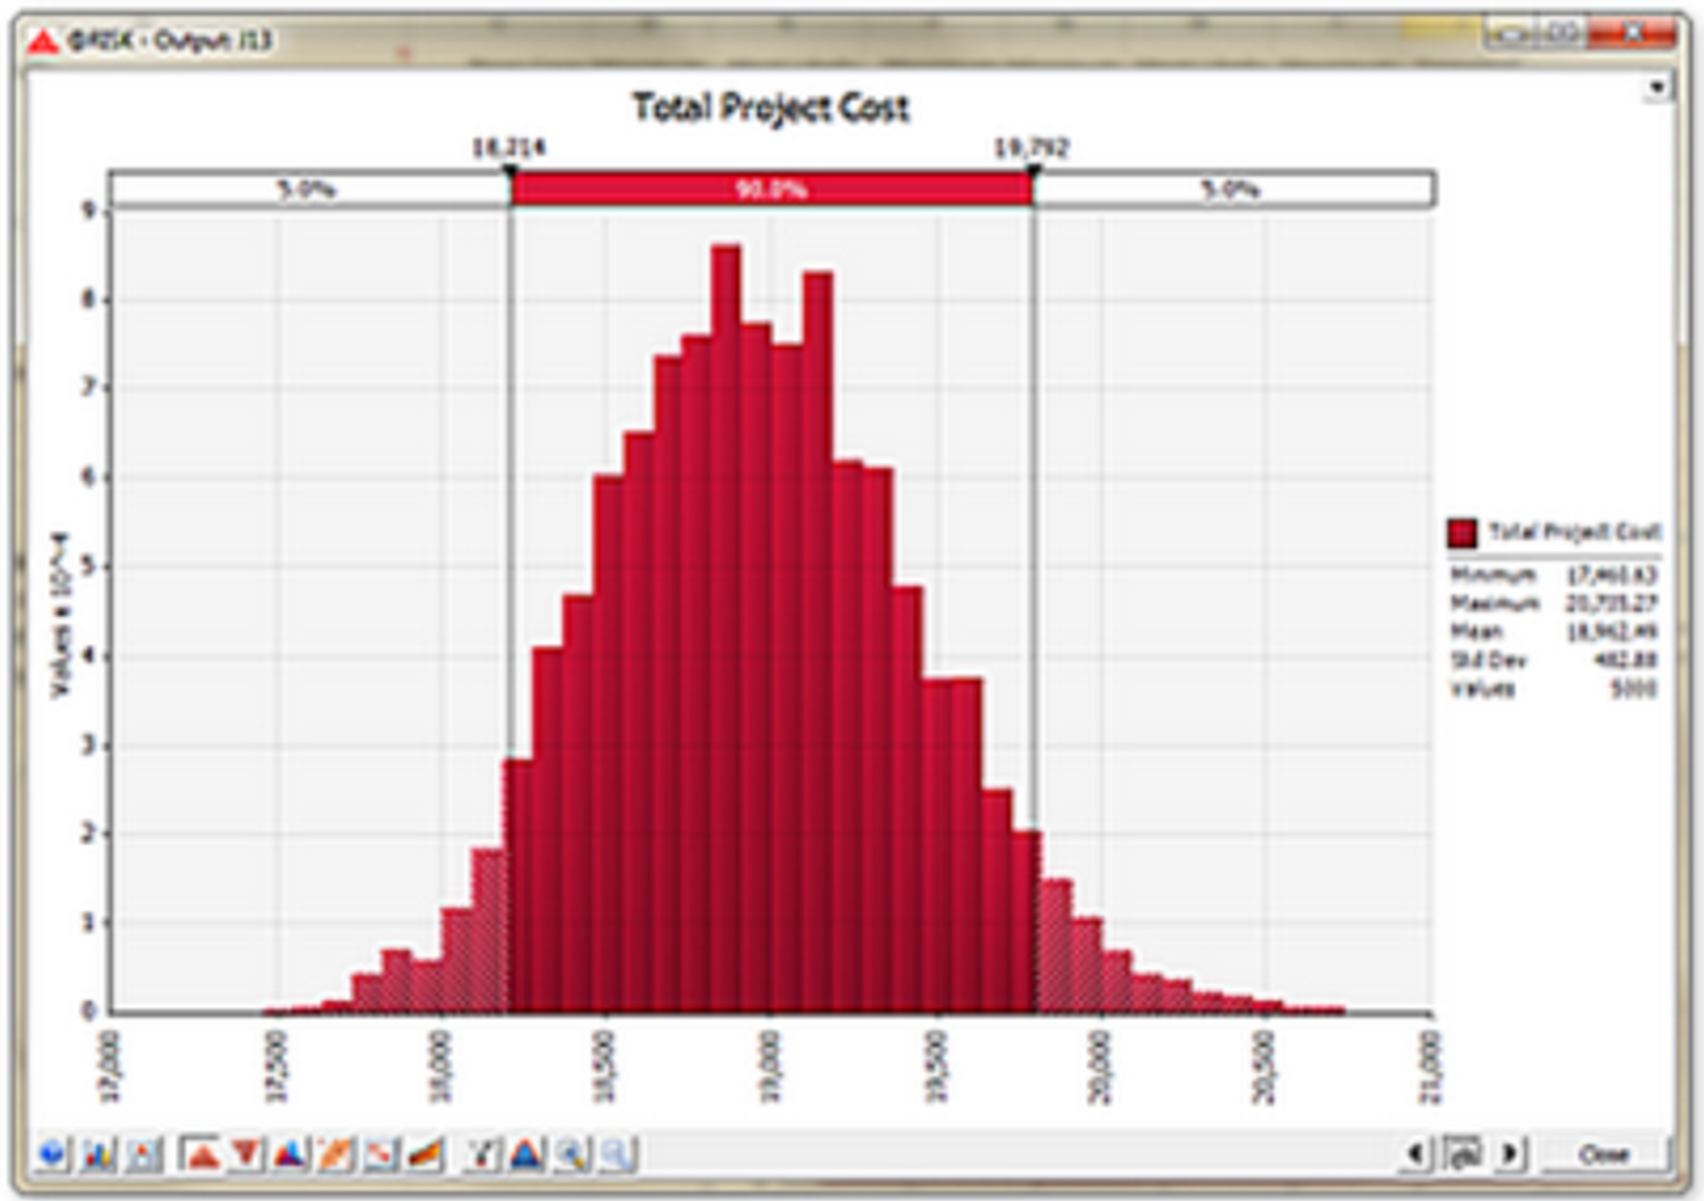
Figure 4 - Monte Carlo Simulation
Source: @Risk for Projects Online Users Manual Tutorials
08.7.3.4 PERT Analysis
The PERT FORMULA and was covered in great detail in Module 4- Managing Risk & Opportunity. This method utilizes the Delphi or Nominal Group Technique to gather the data from a population of “subject matter experts” (SME) and then applies the PERT FORMUAL ((Best Case + (4 X Most Likely) + Worst Case)/6 = Weighted Mean or Weighted Average value)
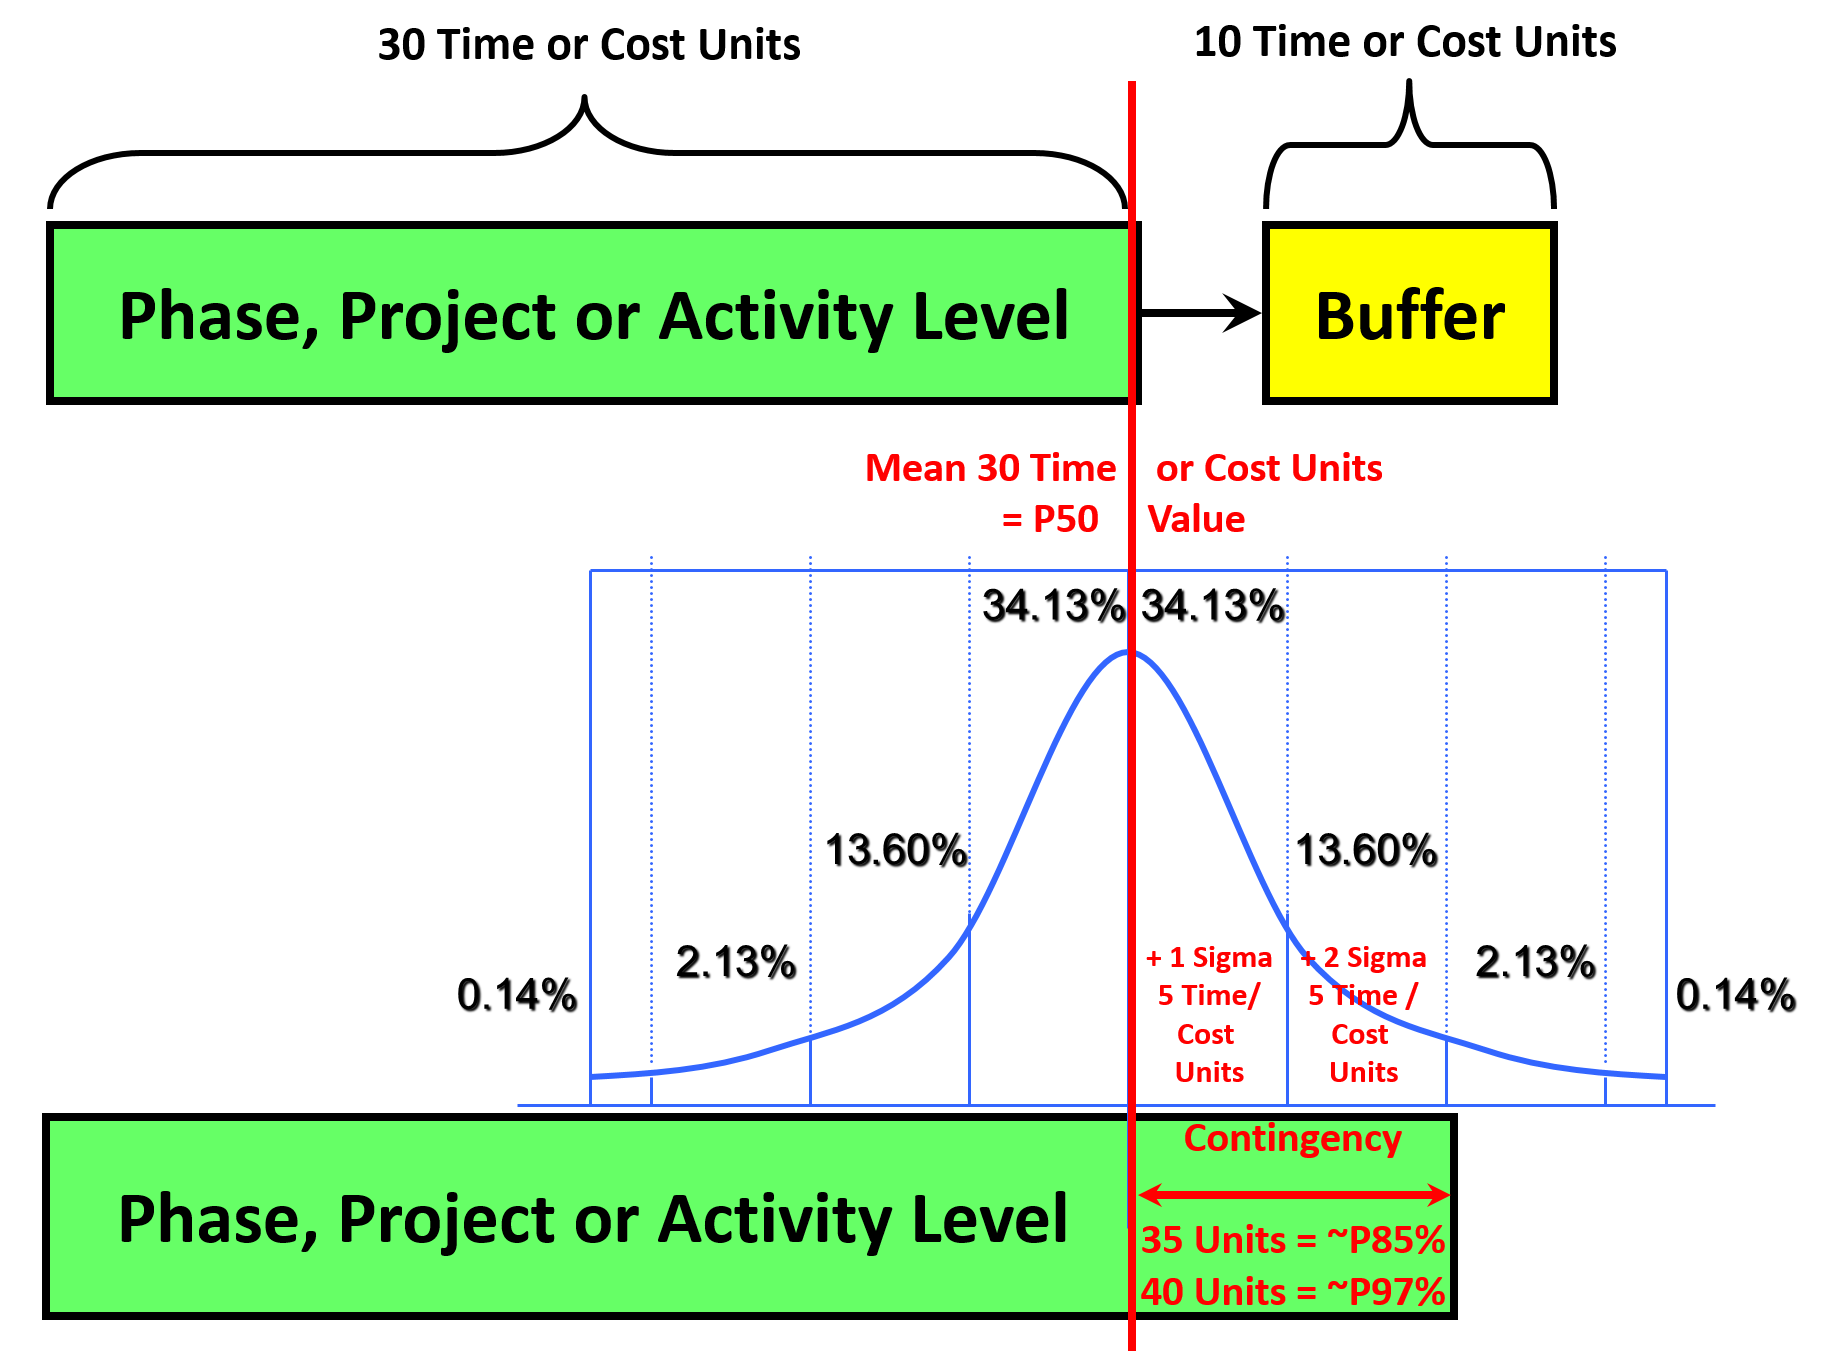
Figure 5 - Illustrating both time and cost risk contingency methods
Source: Giammalvo, Paul D (2015) Course Materials. Contributed Under Creative Commons License BY v 4.0
Referring back to Module 4- Managing Risk & Opportunity and Module 7.9 - Conducting a Schedule Risk Analysis, we know there are two ways to build risk contingency into our schedules or budgets.
One is by adding a BUFFER (based on Eli Goldratt’s “Theory of Constraints”) and the second method is by “burying” it in the cost or duration of an activity.
In cost estimating as we did in planning and scheduling, if we have an UNALLOCATED pool of money or time, that is, it is not allocated to a work package or activity, then it is known as MANAGEMENT RESERVE. Management Reserve is set aside to cover UNKNOWN-UNKNOWNS. It is NOT included in the performance measurement baseline of a project (The S curve) as it is not owned or controlled by the project manager/project control team. If the project team needs to access this pool of money or time, then we need to go to the appropriate management level, make a case why we need it and it may or may not be granted. In most organizations this is not a single person but what is often known as a “Change Control Board” or “Steering Committee”. In the oil and gas sector, this pool of unallocated money is often owned and controlled by the Ministry of Oil and Gas or Natural Resources.
For money that IS allocated to a work package or specific activity, this is known as CONTINGENCY and it is calculated by and is owned and controlled by the project manager/project controls team. This allocate money is used to cover KNOWN UNKNOWNS.
For more on this topic, refer back to Module 4 - Managing Risk & Opportunity
08.7.3.5 Cost vs Time Trade Offs (Optimization)
Now that we have a cost loaded schedule we need to perform one of the more important analysis that any project control team should do for every project and that is to conduct a schedule optimization analysis.
Upon the selection of an appropriate contracting strategy for the project, key cost and schedule parameters should be determined in the design stage, however this analysis is an appropriate and valuable exercise to undertake prior to the start of construction as well as part of each periodic update.
These parameters are paramount for the successful execution of the selected strategy and include:
- Daily Owner Project and Lost Opportunity Costs.
- Incentive (Bonus)/Disincentive (Penalty) amount.
- Baseline and accelerated schedule.
- Costs of acceleration.
Figure 6 below presents a theoretical construct to illustrate the relationships among these key parameters. Combining the concepts of “time-cost tradeoff” and “time is money,” this model is based on the following rationale:
- Project acceleration requires additional labor, materials, and equipment and therefore costs more money.
- Delaying the project beyond the normal completion time results in increased costs due to inefficient allocation and utilization of resources.
- The longer construction takes, the greater the lost opportunity costs and both owner and contractor overhead costs will be.
Proposed by McFarland et al. (1994) , this model can be used to determine the optimum construction completion time at which the direct owner costs and lost opportunity costs are balanced. This model presents three cost curves:
(1) Owner project and lost opportunity costs
(2) Construction costs, and construction engineering costs (combined for the presentation purposes)
(3) Total project costs.
The construction cost curve represents the contractor’s cost for completing the project (assumed to include a normal profit). For illustration purposes, both the contractors duration and cost were assumed to be P50 values.
For every construction project, the construction cost is the lowest (optimized by the contractor) at the baseline duration (4 and 7) Any deviation from this baseline schedule will result in increased construction costs. Expediting completion requires additional contractor effort through tighter schedules and overtime, additional resource mobilization and deployment and/or innovation, and incurs additional costs to the contractor. Extending the completion beyond the baseline duration results in penalty and misallocation and underutilization of resources, along with extended overhead, hence incurring additional costs to the contractor. In other words, the construction costs increase with each additional day saved (-) or delayed (+) from the standard or baseline schedule.
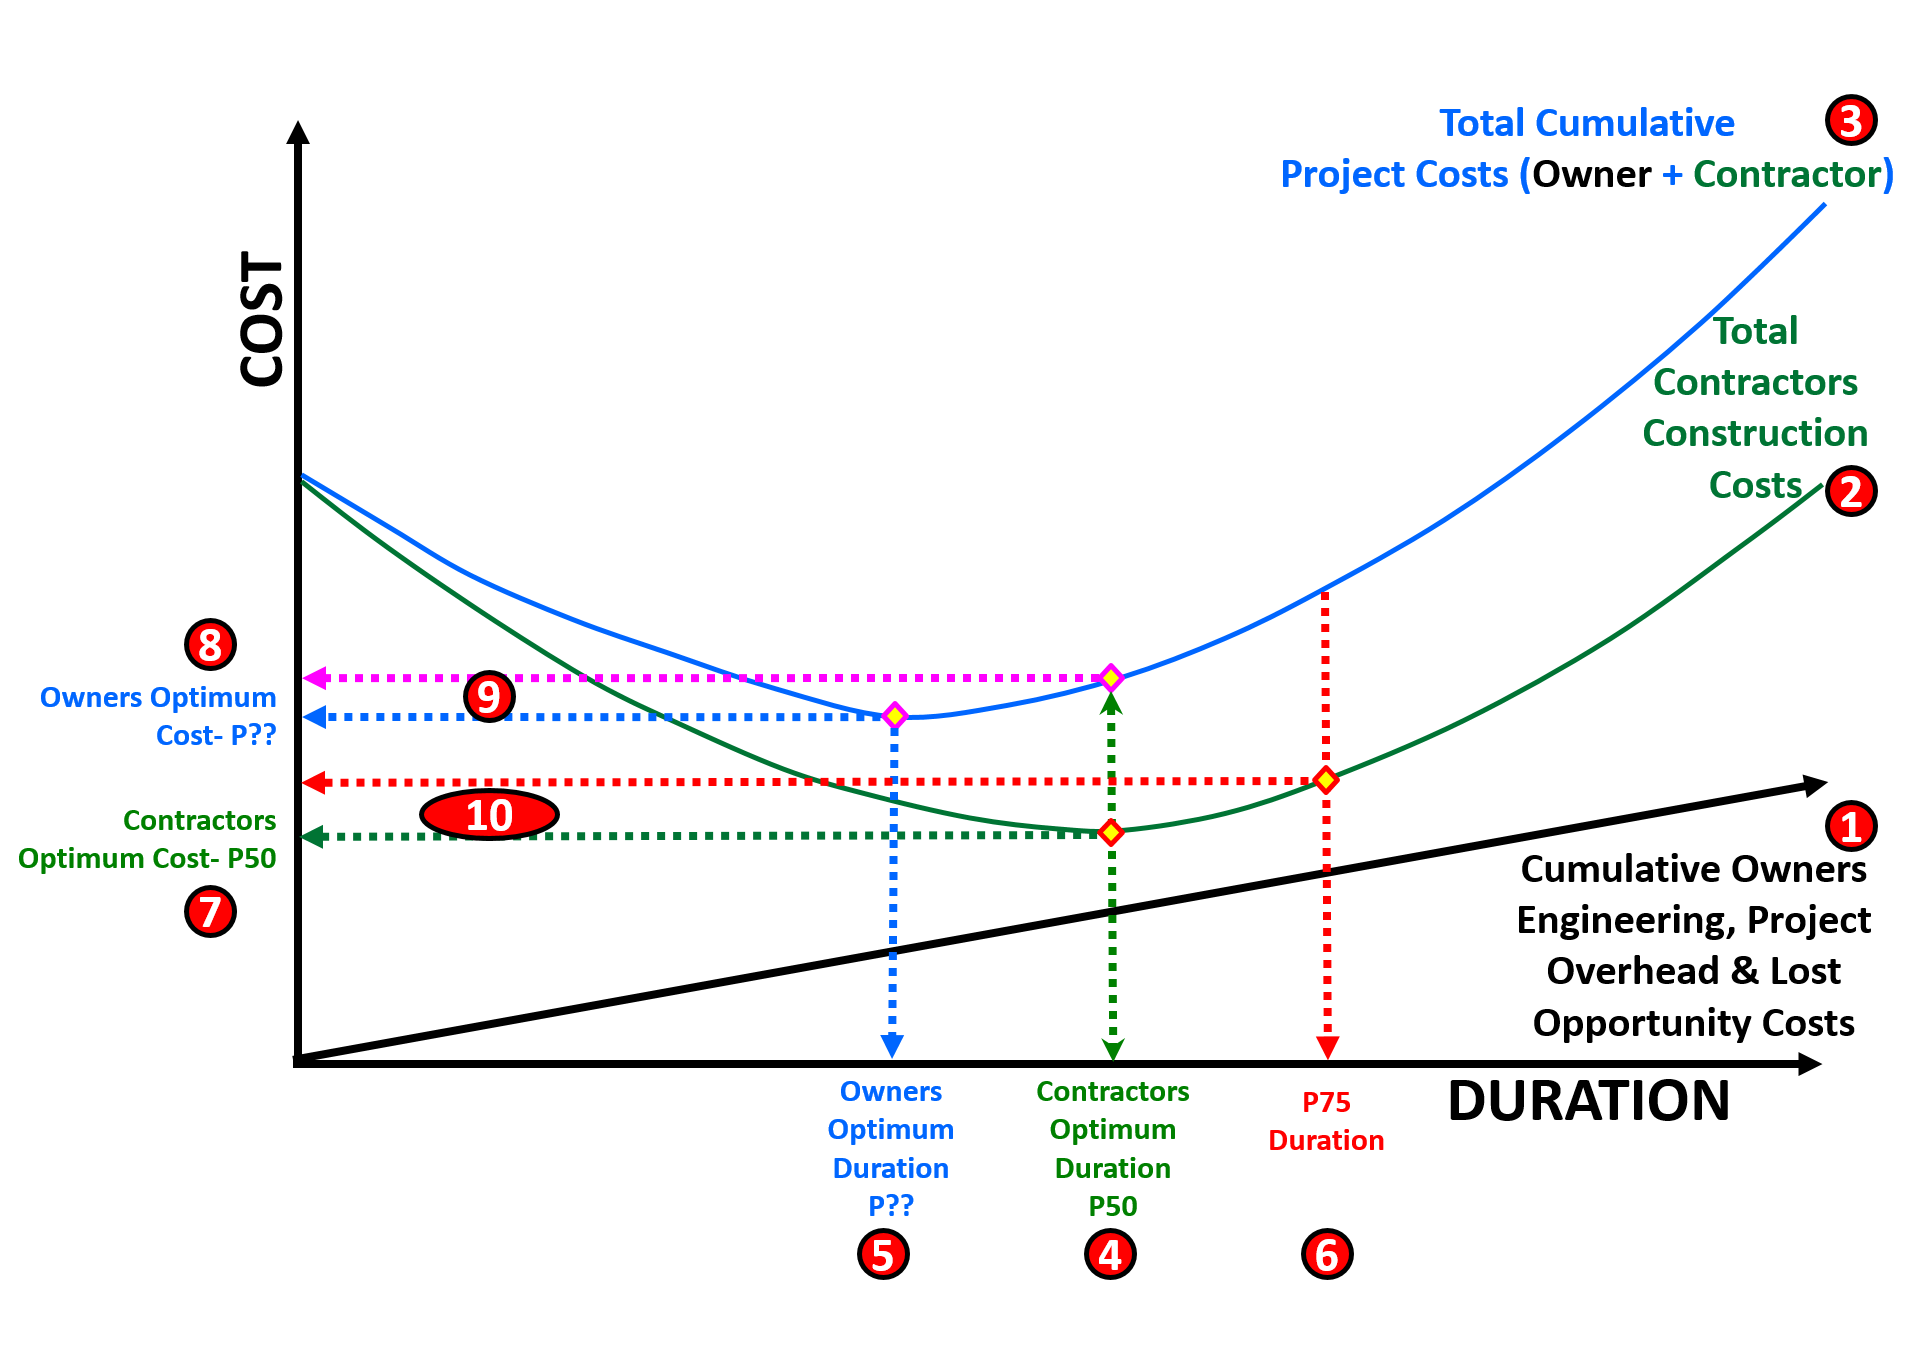
Figure 6 - Schedule vs Time Optimization
Source: Work Zone Road User Costs Concepts and Applications (2011)
Given that the Owner’s optimum duration and cost is almost always different from that of the contractor, how can we equitably reconcile the differences? And the answer to that question comes from the differences between the Owner’s Optimum Cost (8) and where the Contractors Optimum Duration (4) intersects the Total Cost curve (9) This is what determines the incentive from the owner to the contractor to complete the project in the owner’s optimum time frame.
Conversely, if we look at the difference (10) between where the Contractors Optimum Cost (7) and the P75 Duration (determined using simulation) intersects the Contractors Cost curve (2) it provides us with the penalty or disincentive calculation (10)
For a more detailed explanation, along with the formulas, here is the reference:
- US Dept. of Transportation, Federal Highway Agency, (2011) “Work Zone Road User Costs Concepts and Applications” FHWA-HOP-12-005
08.7.4 OUTPUTS
Cost And Resource Loaded Schedule Optimized Between Time And Costs (Owners Perspective)
- Realistic Dates Incorporated Into The Contract Documents)
Cost And Resource Loaded Schedule Optimized Between Time And Costs (Contractors Perspective)
- Optimized Use Of Scarce/Limited Resources
- Minimized Project Overhead Costs
08.7.5 REFERENCES & TEMPLATES
- GAO “Best Practices In Scheduling” Http://Www.Gao.Gov/Assets/600/591240.Pdf Best Practice 1 Pages 10-24
- GAO Cost Estimating And Assessment Guide Best Practices For Developing And Managing Capital Program Costs Http://Www.Gao.Gov/New.Items/D093sp.Pdf
- US Dept. Of Transportation, Federal Highway Agency, (2011) “Work Zone Road User Costs Concepts And Applications” Fhwa-Hop-12-005 Http://Www.Ops.Fhwa.Dot.Gov/Wz/Resources/Publications/Fhwahop12005/Fhwahop12005.Pdf
08.8 - Module 08-8 - Validating Horizontal And Vertical Integration
08.9 - Module 08-9 - Conducting A Cost Risk Analysis
08.10 - Module 08-10 - Baselining And Communicating The Cost Estimate/Cost Budget
GPCCAR M08-7, Revision 1.00