10.0 - MANAGING CHANGE
10.1 - Module 10-1 - Introduction to Managing Change
10.2 - Module 10-2 - Develop The Managing Change Policies & Procedures Manual
10.3 - MODULE 10-3 - MANAGING CHANGE - THE OWNER'S PEREPCTIVE
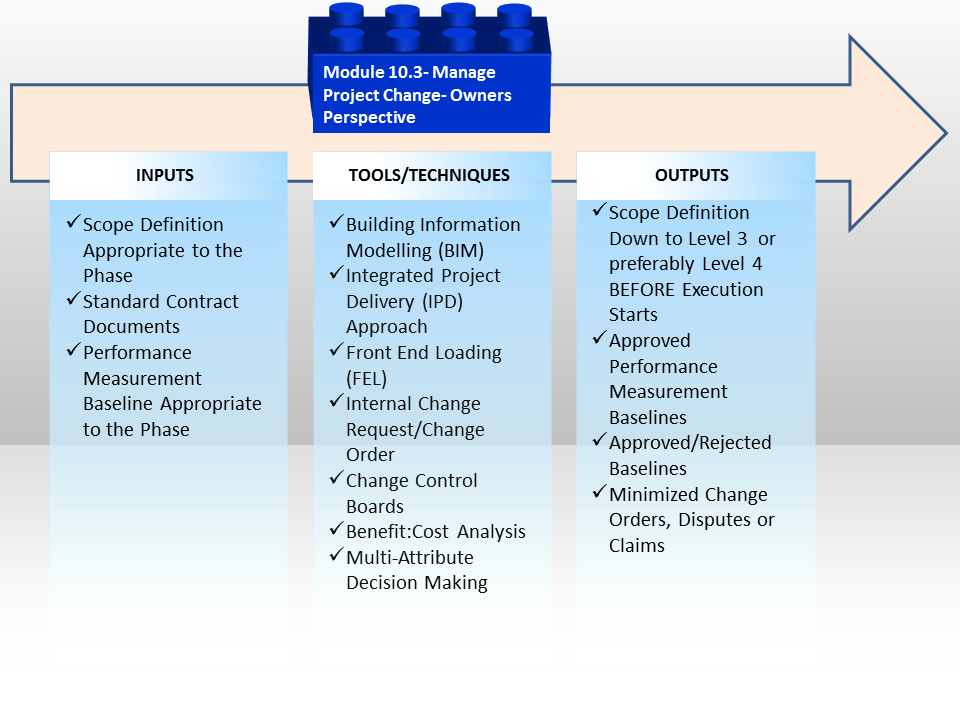
Figure 1 - Managing Change - The Owner's Perspective
Source: Guild of Project Controls
10.3.1 INTRODUCTION
The managing change process for an OWNER organization is a bit more complicated than for the CONTRACTOR. The reason for that being is the OWNER organization there are two potential sources for change orders:
1) INTERNAL or those initiated from within the OWNERS own organization. This is one of the leading causes of what is known as “Scope Creep” or in the case of a program, “Mission Creep” where stakeholders INTERNAL to the organization keep on adding features or capabilities often well beyond what was originally intended when the business case was written. The classic example of this is the US Pentagon’s “Bradley Fighting Vehicle” story.
2) EXTERNAL or those initiated by either the CONTRACTOR or the OWNERS PROJECT MANAGEMENT team, which pertain to problems encountered during the project’s design and/or execution phase. These problems are usually less of a challenge to manage than INTERNAL change orders, as the contract documents usually spell out a very detailed change control process, which is often missing or less robust than for INTERNALLLY generated change orders.
However for OWNER organizations, if you adopt the same or similar processes and rigorous review process that you have between the OWNER and CONTRACTOR and apply those same processes, procedures and rigor to all change orders, managing them should result in better outcomes both in terms of the PROJECT success as well as the success of the PRODUCT the project was undertaken to create or produce.
10.3.2 INPUTS
- Scope Definition Appropriate to the Phase
- Standardized Contract Documents
- Performance Measurement Baseline Appropriate to the Phase
10.3.3 TOOLS & TECHNIQUES
10.3.3.1 Building Information Modelling (BIM)
Building Information Modelling (BIM) is a fully integrated model which follows the creation of a physical asset through its entire lifespan, from concept through design, construction, operations & maintenance through renovation and eventual demolition or repurposing. BIM is going to have a profound impact on the practice of project controls as the design databases are “hot linked” to the CPM scheduling and cost estimating databases which means as the structure is designed and built in three dimensions, the CPM schedule and cost estimate are being generated at the same time. While this will unlikely reduce the role the project control professional has played in terms of quantity take offs and creating CPM schedules, it will open opportunities to create, update and manage the cost and productivity databases which are necessary to make 4D and 5D BIM work.
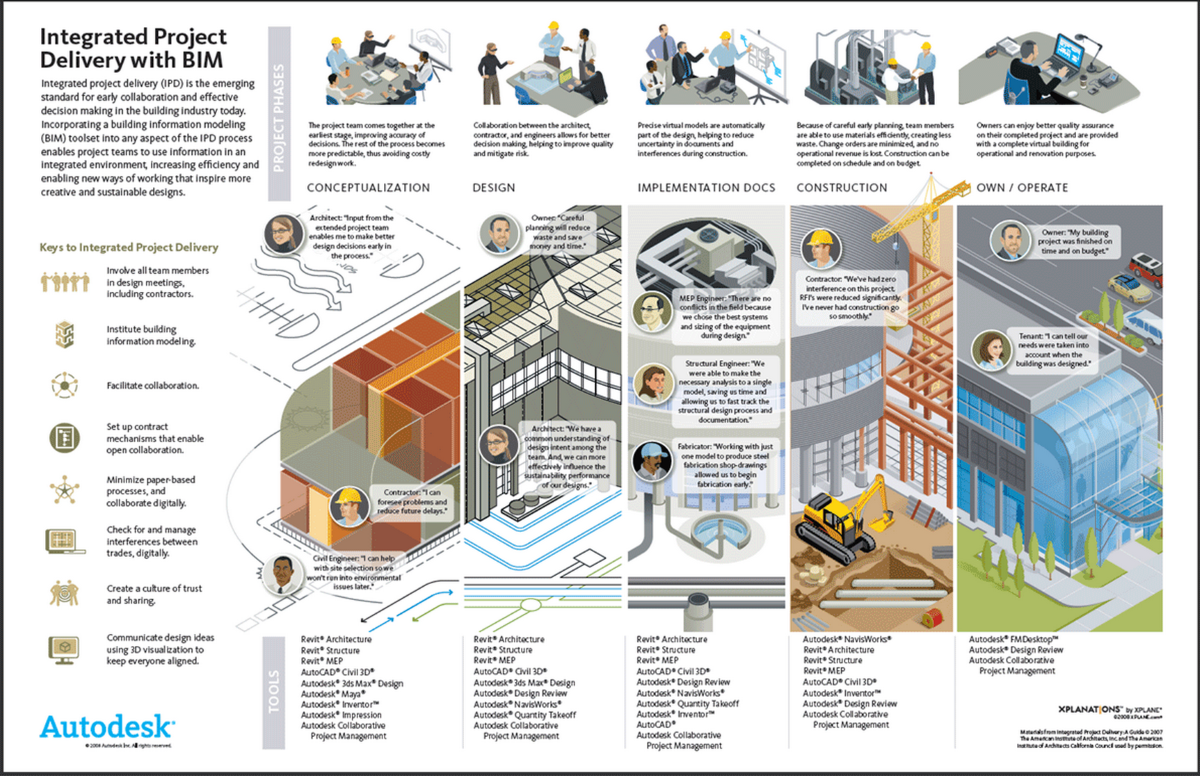
Figure 2 - Integrated Project Delivery using BIM
Source: Hagerman & Company Blog
10.3.2.2. Integrated Project Delivery (IPD) Approach
Integrated Project Delivery Approach is designed to move as much of the scope definition as early as possible in the project development process.
Here again we see evidence of this “left shift” moving as much of the decision making earlier in the process with the objective to freeze the scope baseline well before execution begins. This will have a profound impact on the practice of project controls as it moves our responsibilities from tracking and reporting (“Project Police” model) to one where our knowledge of cost and schedule will be put to use earlier in the process, well before construction has begun on the project.
This will change our focus from being reactive into being proactive, trying to avoid changes, claims and disputes. This will require our services as subject matter experts to develop, update, maintain and expand upon the various coding structures as well as the cost and productivity data necessary to create more accurate, reliable and precise cost estimates.
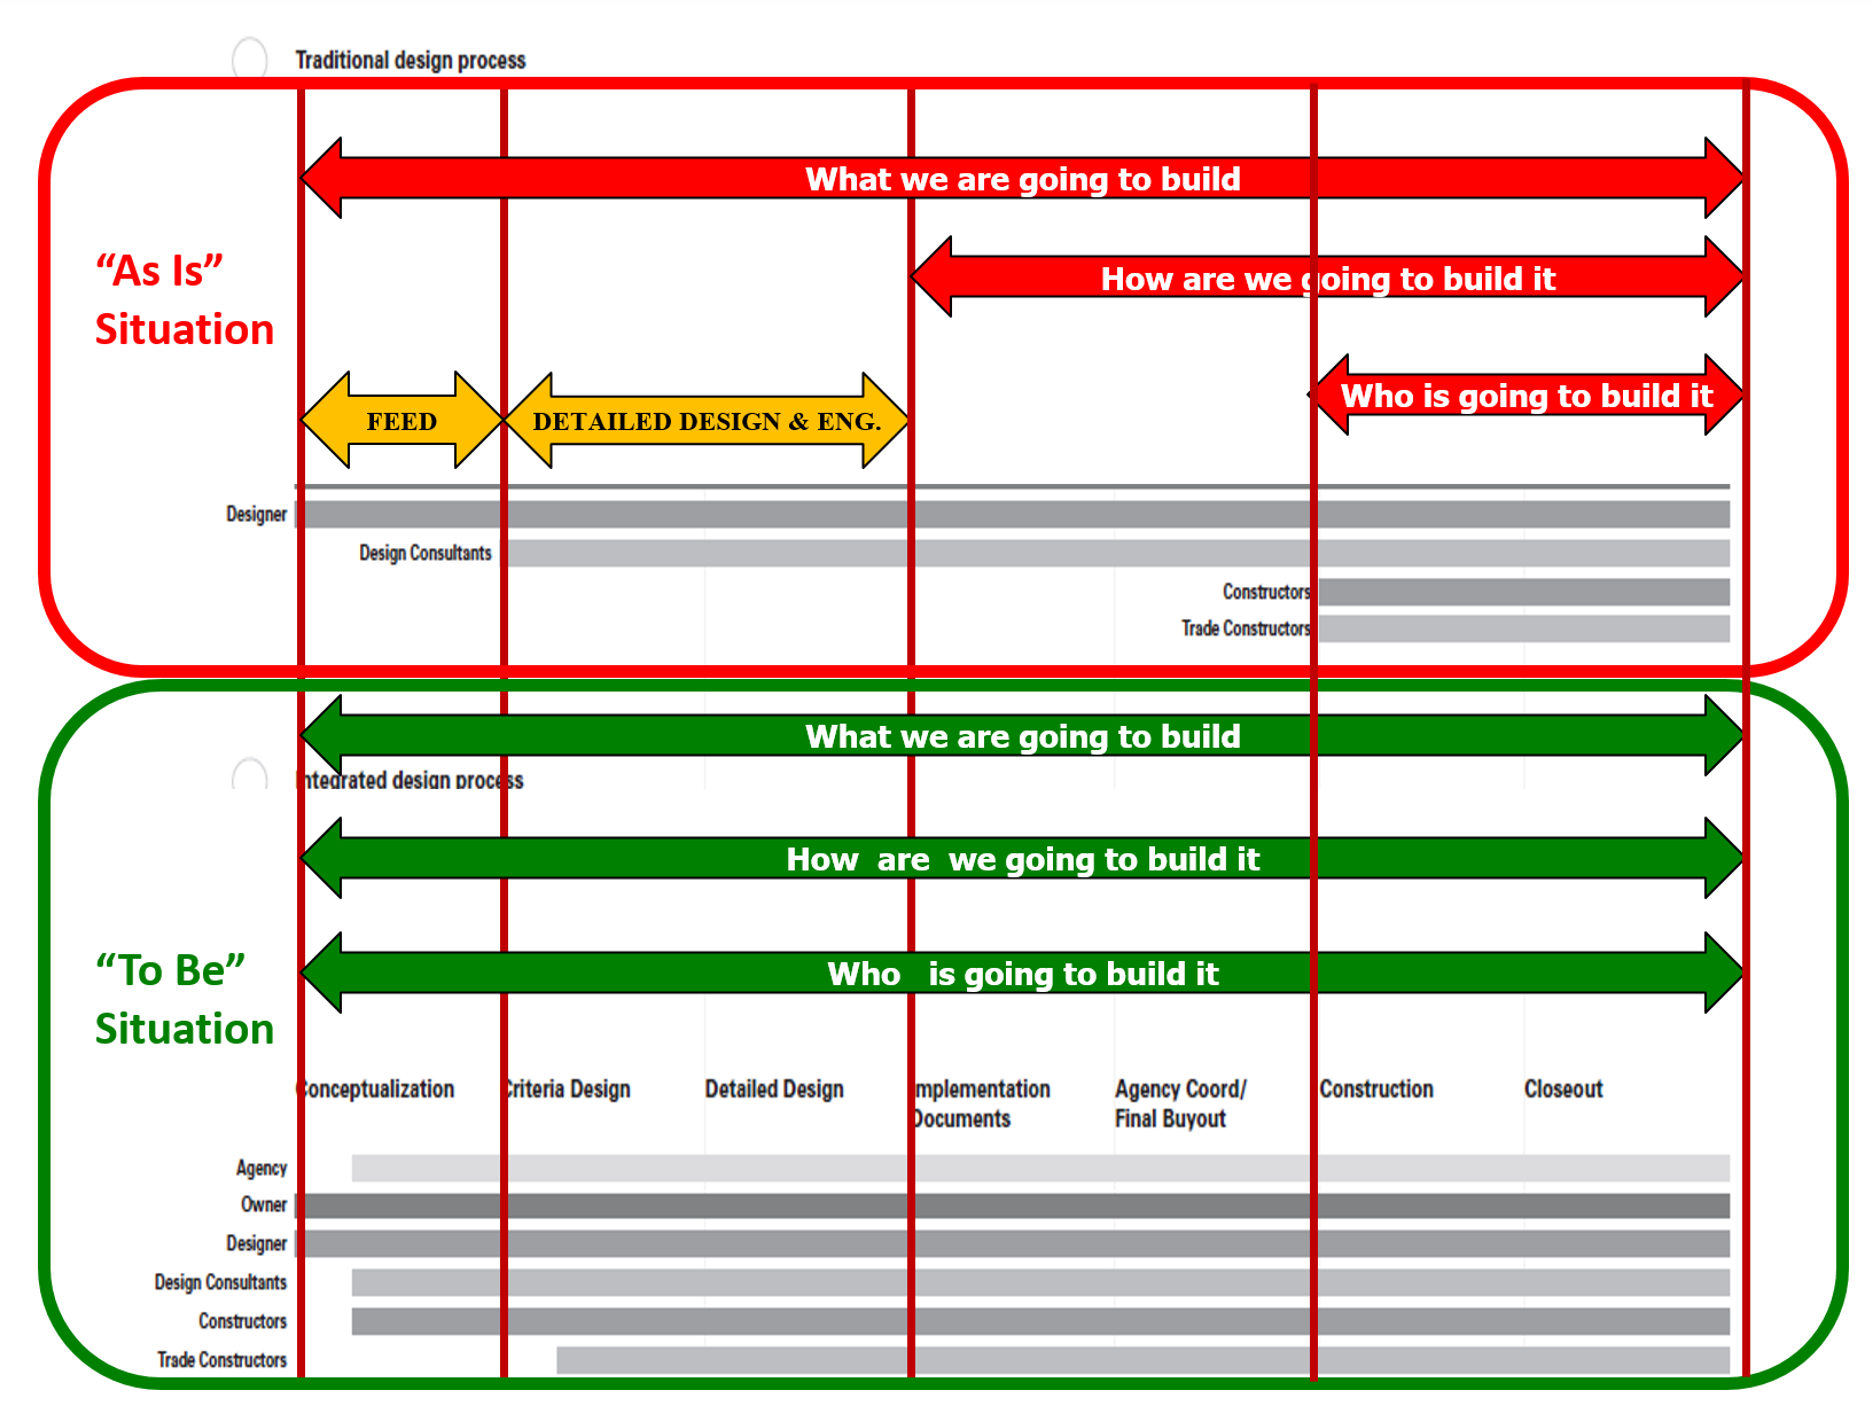
Figure 3 - AIA’s Integrated Project Delivery Approach Showing the “Left Shift” (AIA)
Source: Giammalvo, Paul D (2015) Course Materials. Adapted from AIA Integrated Project Delivery Approach (IPD) (2007) Contributed Under Creative Commons License BY v 4.0
As we can see the “How We Are Going to Build It” which is where the project control practitioner can add value has been moved from the Execution Phase to the Conceptual Design Phase.
10.3.3.3 Front End Loading (FEL)
This is a term unique to the oil, gas and mining sector and what it describes is the same “left shift” in focus described in the previous graphics.
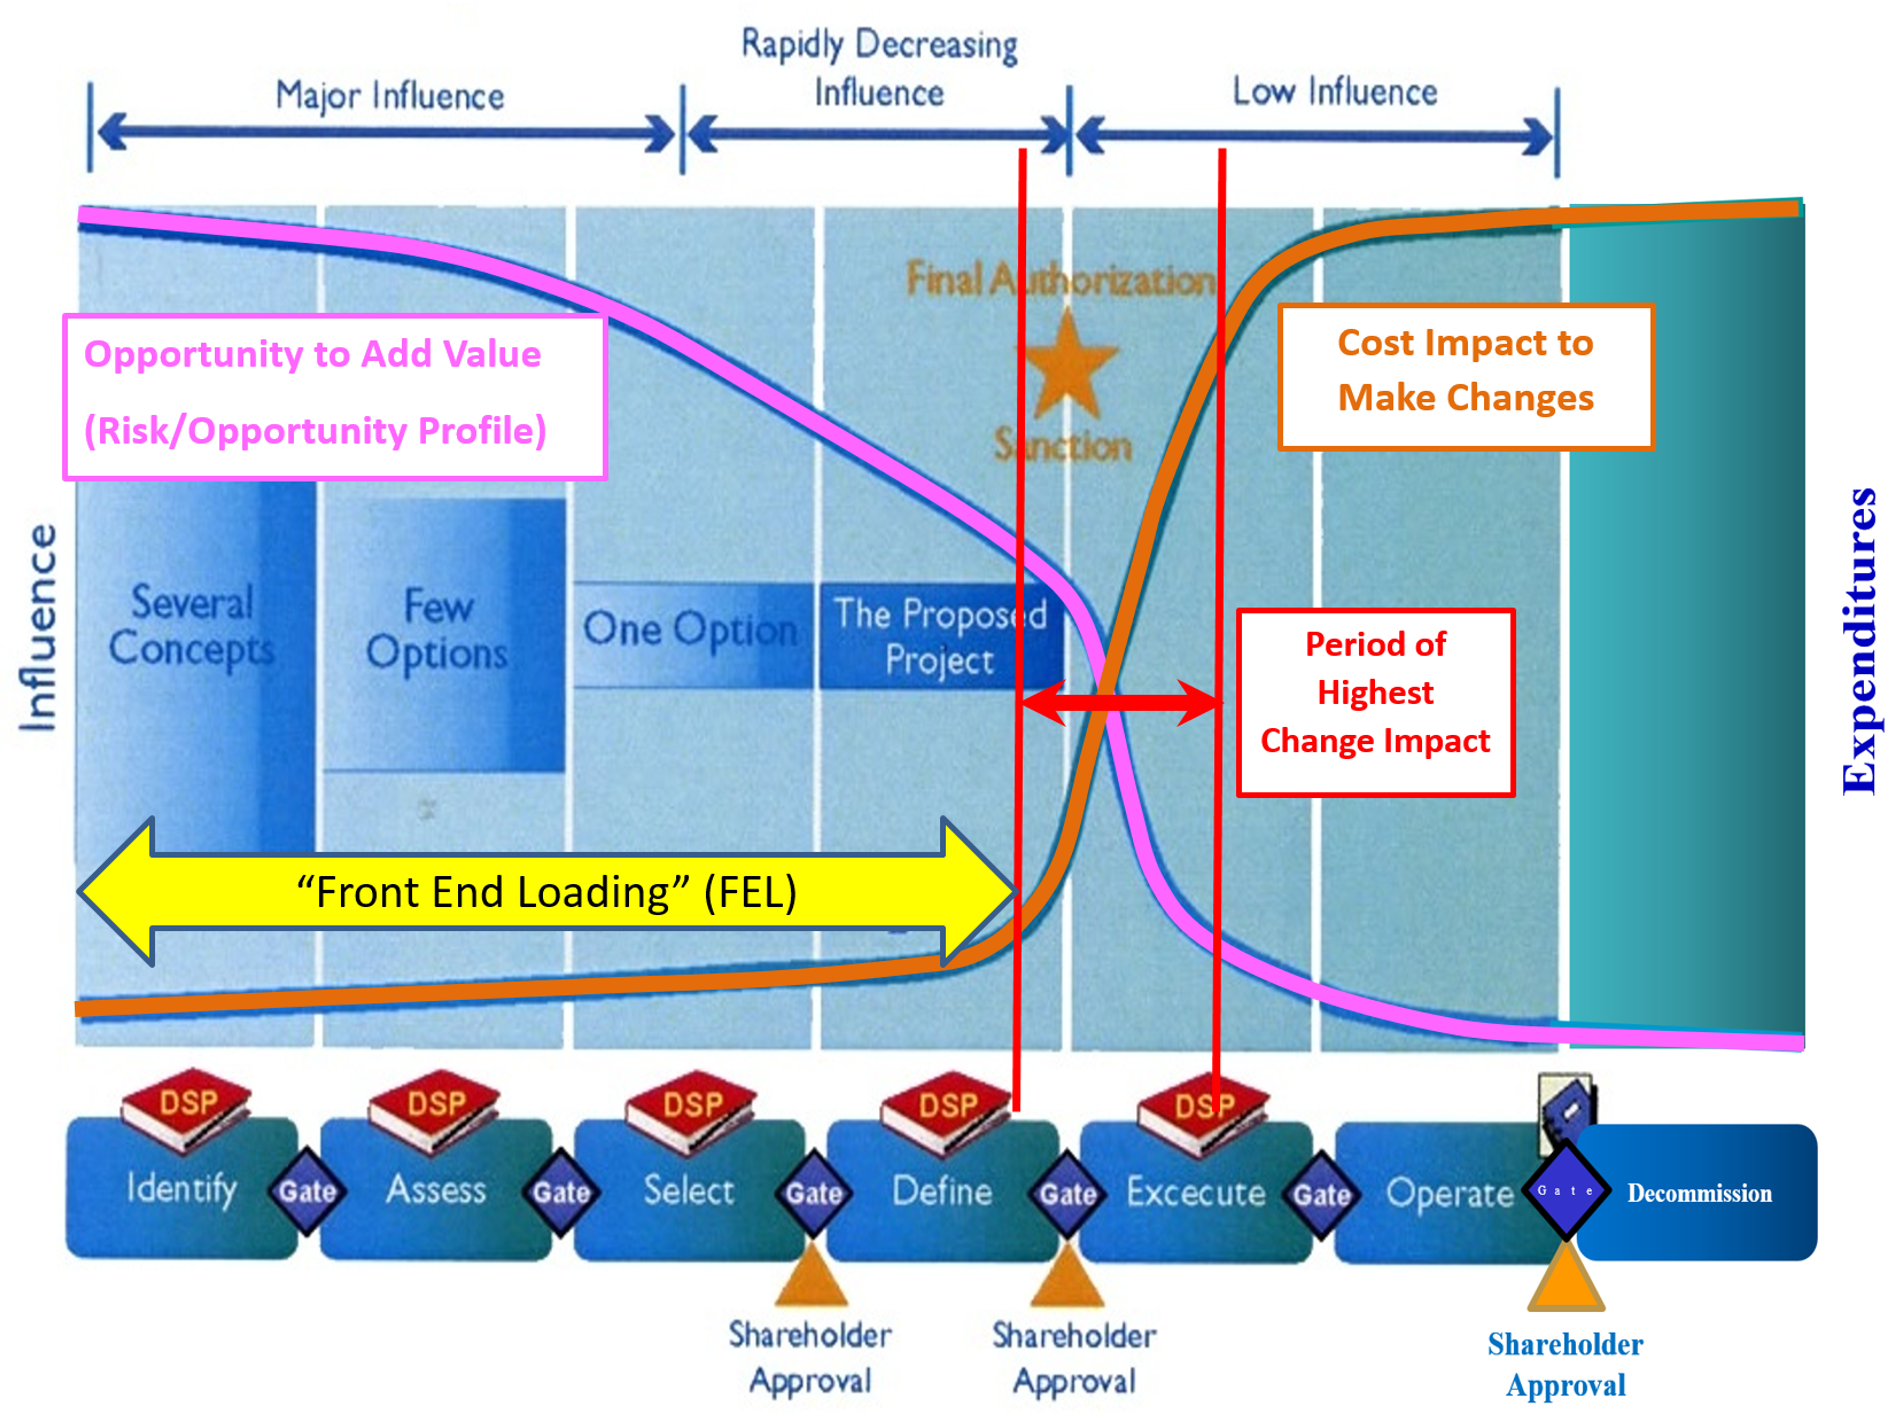
Figure 4 - Concept of “Front End Loading” (FEL) Illustrated (MacLeamy Curve)
Source: Giammalvo, Paul D (2015) Course Materials Contributed Under Creative Commons License BY v 4.0
Essentially there is a growing consensus that owners in particular are simply not doing an adequate job of deciding what it is they need or want and then investing the time and energy BEFORE construction or execution starts to define the scope of work. Clearly when the scope of work is known and assuming the contractors are competent and cabable, projects do finish on time and within budget, safely and in substantial compliance to what the owner needed and wanted. However, it is clear that the key to that success is for the owner to decide what they REALLY need and want.
For more on this term and concept, the two most recent and outspoken authors are:
- Edward R Merrow, IPA “Industrial Megaprojects- Concepts, Strategies and Practices for Success”
- Bent Flyvbjerg Oxford University “Megaprojects and Risk”
10.3.3.4 Internal Change Request or Internal Change Order
Any change that is requested WITHIN the organization sponsoring or creating or funding a project should require a formal change order request. As this is not a contractual matter, the document used should not be the same as used between the owner and contractor, although it should contain much the same information. As scope changes within an organization are often one of the leading causes of projects running late and/or over budget, the process to review and either accept or reject them should be formalized and be sufficiently robust as to avoid any unnecessary changes while at the same time, ensuring that the project satisfies the needs for which it was undertaken to achieve or realize.
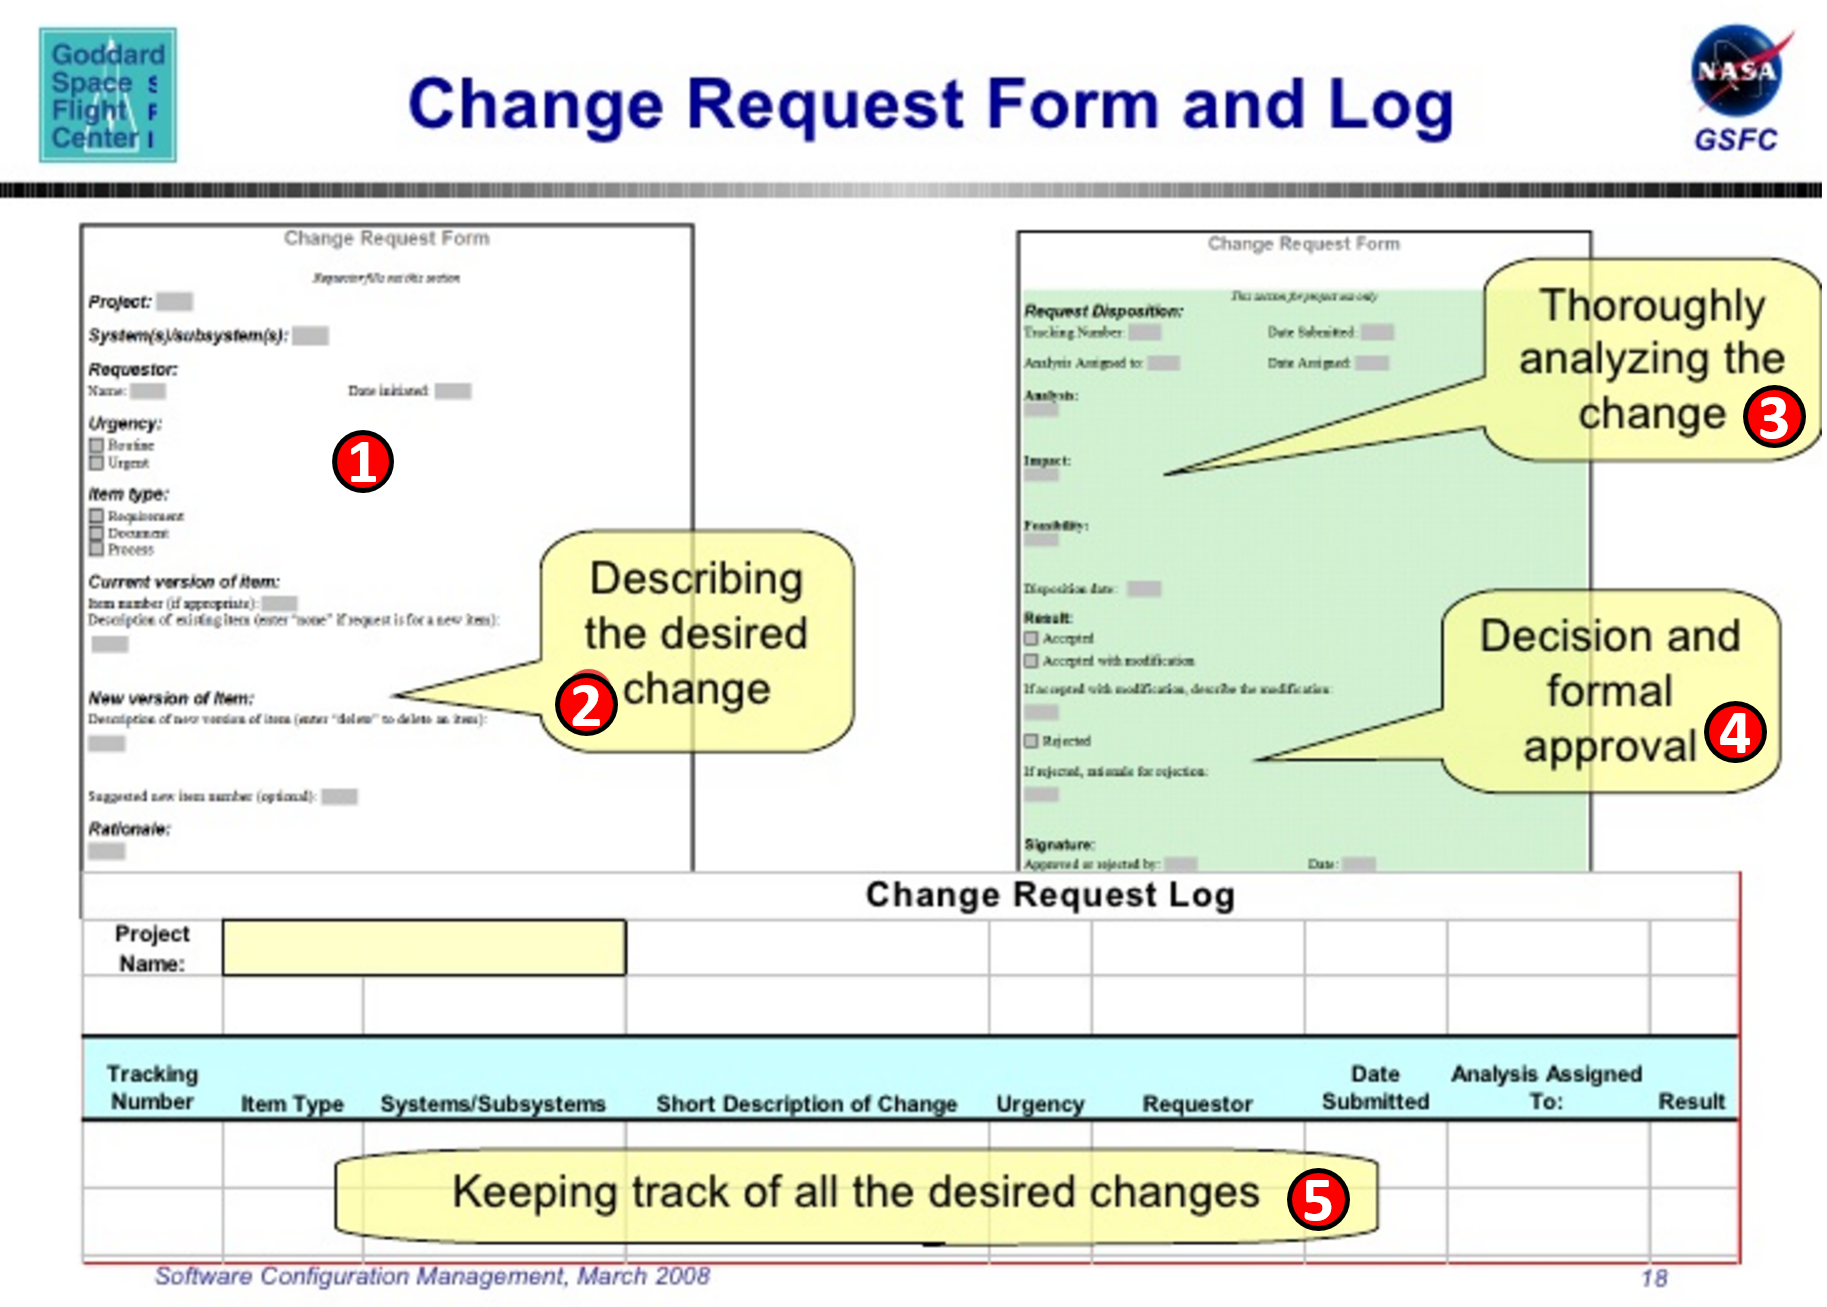
Figure 5 - Internal Change Request Form used by NASA
Source: Sekira, Susan (n.d.)
In Figure 5 above we have taken an actual form developed and used by NASA to initiate, document, evaluate, accept/reject and track an INTERNAL change order. This is NOT the form used between NASA and any of their contractors but a form to initiate changes requested internal to the organization.
As you can see, it is not a complicated document which only contains 5 major pieces of information:
(1) In this section you have the project, the initiators name, the type of request (i.e. equipment, technical, design or procedural) and the urgency.
(2) In this section the initiator (which can be anyone in the organization) describes the change, addressing to as great an extent as possible:
- Who - Who is asking for the change we are desirous of doing- Enter who the changes affect.
- What - This is What we are desirous of doing enter the description of the proposed change here. List the scope and details of the change here List potential hurdles
- Why - Why we are asking for the change we are desirous of making. Enter the Cost Benefit arguments here, or attach Cost Benefits Analysis, also illustrate other savings or productivity increases here Explain how this solution was selected and a brief overview of rejected solutions with reason for rejection
- Where - This is where the changes will take place, enter where the changes occur, and where the resources identified to implement the change come from List any positive and negative impacts on the locations where the changes will occur
- When - When we plan on implementing the change we are desirous of making
- How - Who are the resources identified to implement the change
- How Much - If for an internal change order, the cost estimate should be consistent with the acceptable ranges appropriate to the phase gate. If this change order is being quoted by the contractor, he/she needs to be clear if the price quoted is a firm fixed price, guaranteed not to exceed, time and materials or whatever. Ideally all changes should be “forward priced” or “forward quoted”- that is, the price as well as any time impacts should be agreed to in advance of the change order being approved or work directive being issued. Assuming the change request is a good one, the more information the initiator can provide, the more likely the request will be analysed fairly and impartially, thus more likely to get approved.
(3) In this step, depending on the type of request it would undergo an INDEPENDENT review by engineering, project manager/project team, including project controls who would then make recommendations to the Change Control Board to either ACCEPT the request or REJECT the request.
(4) Based on the recommendations of the various Subject Matter Experts (SME) the Change Control Board makes their decision and signs the form.
(5) A tracking number is assigned and a log documenting the changes made is kept. Ideally this log number would also be incorporated into the impacted Activities, usually using the “Notes” field
This is a typical example and if you are a project controller working for an owner organization and you do NOT have an internal change order process in place, you need to propose creating one.
10.3.3.5 Change Control Boards
As noted above, Internal Change Requests or Internal Change Orders need to be treated seriously and the best or most effective means to address them is to create an independent “change control board” which can make impartial decisions about which changes truly add positive benefit and which ones are merely “nice to have” or “gold plating”.
KPMG offers an excellent graphic which explains that managing change is all about managing risks and provides some insights as to what role project controls can and should be playing in this process.
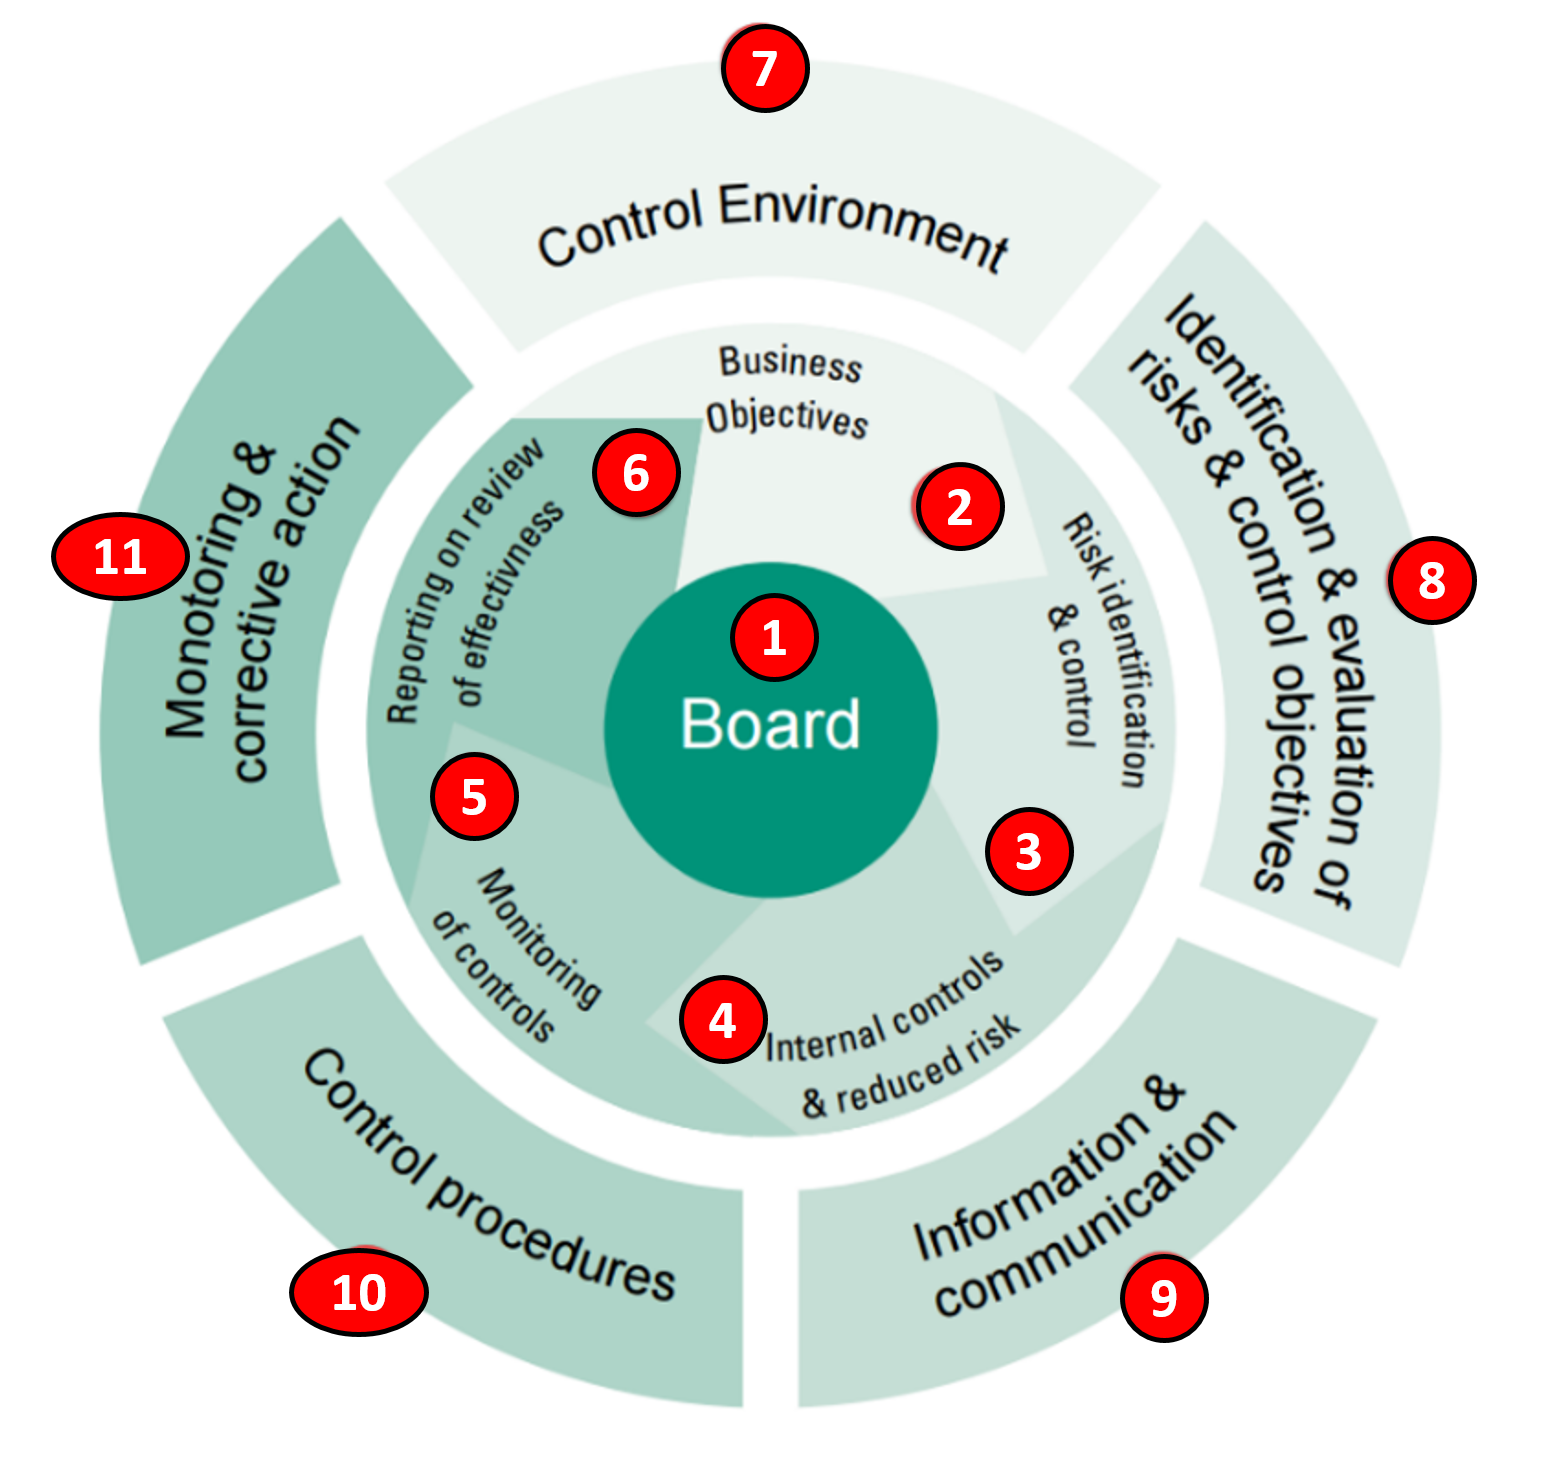
Figure 6 - KPMG graphic to the right showing the roles and responsibilities of a Change Control Board
Source: The KPMG Review Internal Control: A Practical Guide (1999)
(1) The Change Control Board’s primary responsibility is to review proposed changes to a project and with input and support from project controls, makes an independent evaluation of any proposed changes and either ACCEPTS them or REJECTS them.
(2) One of the first responsibilities of the Change Control Board is to evaluate whether the changes does or does not support the business objective for which the project was undertaken to achieve and if yes, the to what degree. The primary tool/technique is using “Benefit : Cost Analysis” but they can also use Analytical Hierarchy Process (AHP) or Multi- Attribute Decision Making (MADM) models.
(3) As every change order represents a potential risk to the project, all change orders need to be backed up by a risk analysis using our standard risk analysis processes. This risk assessment should be prepared by the project controls team and should follow the same process and procedures we learned in Module 4 - Managing Risk & Opportunity, starting with updates to the risk register whenever a change order is accepted.
(4) The board will or should also require that the change be monitored and controlled, just as the project is, meaning this task falls to the project control team.
(5) The monitoring process for project change is identical to that used for other activities in the project, which we can find in Module 9 - Managing Progress.
(6) Like all activities, change orders need to be monitored, controlled and reported on not only during the project’s execution phase but for an owner we want to also know if the change was a positive one- that the benefits exceeded the cost.
(7) The Control Environment we use is identical to the Initiating, Planning, Executing, Controlling and Closing processes used for the project itself.
(8) Because each change represents a potential risk, once the risks have been identified and recorded in the risk register, they need to be managed the same as all other risks on the project.
(9) Change order tracking and reporting needs to be a separate component of the periodic reporting period. Which is why as we demonstrate below, it is the responsibility of the project controls team to add an activity for every change order and be able to quickly and accurately identify which activities are from the original baseline and which are change orders.
(10) The control procedures used in initiating, planning, executing, controlling and closing change orders is identical to the policies and procedures followed for the original project plan.
(11) Lastly, the same monitoring tools and techniques we find in Module 9 - Managing Progress, apply to the change orders, including tracking and reporting both past performance as well as future performance.
10.3.3.6 Benefit Cost Analysis
The primary tool / technique used by Change Control Boards is Benefit Cost Analysis (CBA). This is the process of quantifying costs and benefits of a decision, program, or project over a period time.
Unlike the present value (PV) method of appraisal, CBA estimates the net present value (NPV) of the decision by discounting the investment and any returns. Though employed mainly in financial analysis, a CBA is not limited to monetary considerations only. It often includes those environmental and social costs and benefits that can be reasonably quantified.
The formula for Benefit Cost Analysis= Net Present Value (NPV) of future cost savings other benefits (both tangible and intangible) / NPV of both tangible and intangible investment costs
If the result is >1 (i.e. the benefits exceed costs) then the change is generally approved.
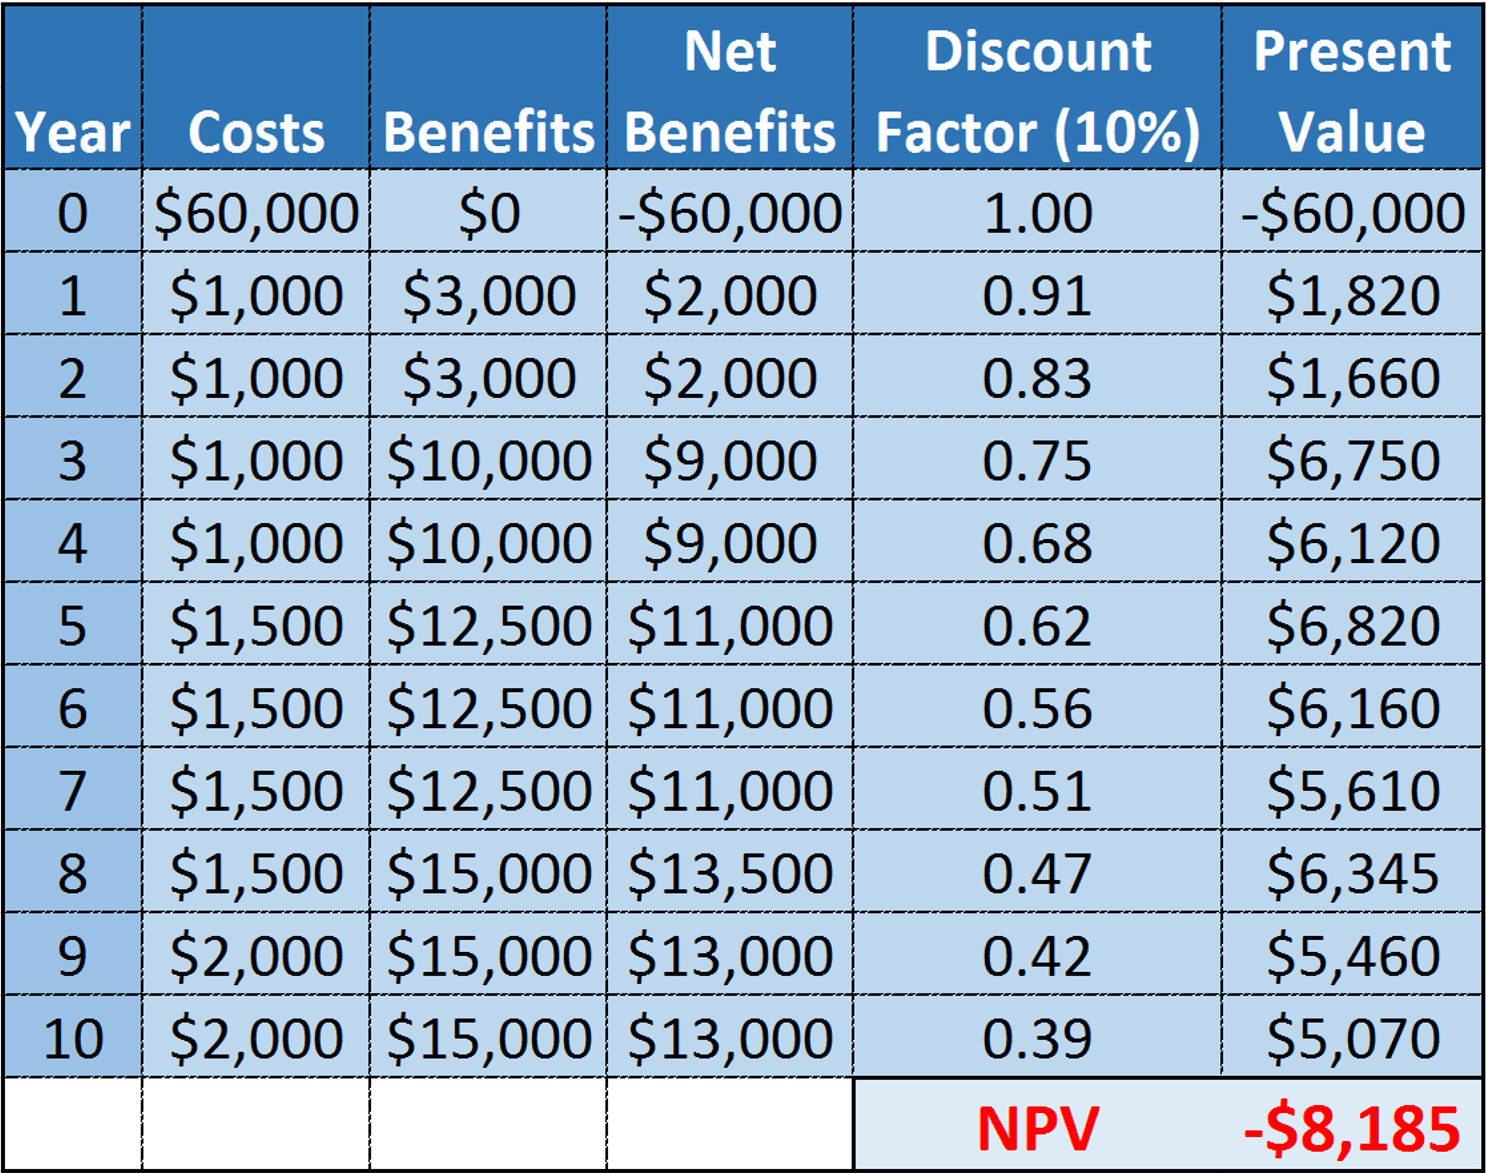
Figure 7 - A Simple Benefit Cost Analysis
Source: Giammalvo, Paul D (2015) Course Materials Contributed Under Creative Commons License BY v 4.0
In the example above we have a simple Benefit Cost Analysis showing that the Net Present Value (NPV) of both the costs and the benefits of a change order is negative $8,185 (1) using a 10% interest rate.
Note that we can also make the same decision based not only on NPV but also by calculating the Internal Rate of Return (IRR) or External Rate of Return (ERR) and in the event the IRR or ERR was less than 10%, then we would also reject the Change Order request.
10.3.3.7 Multi-Attribute Decision Making
Another less common tool / technique but arguably enough a more useful one which can be used in place of Benefit Cost Analysis is Multi-Attribute Decision Making (MADM). MADM methods are most useful when there are subjective attributes rather than financial attributes to consider.
There are 2 approaches to this method, Non-compensatory models which treat all the attributes as being equally weighted and the compensatory model which enable us to weight the different variables.
The non-compensatory approach consists of 5 different tools/techniques:
- Dominance
- Satisficing
- Disjunctive Reasoning
- Lexicography
While the compensatory approach consists of two models:
- Non-Dimensional Scaling
- Additive Weighting Technique
While these are useful tools that all project controls practitioner should at least be familiar with. The best way to illustrate the different approaches is using a simple case study. This one comes to us from Sullivan Wickes and Koeelling’s “Engineering Economy- 15th Edition, Chapter 14 “Making Decisions Considering Multi-Attributes”.
Scenario: Kathryn Lee is a top engineering graduate who, based on comprehensive reasoning, has just accepted a job in Your Country. Having chosen the job in Your Country, using Multi-Attribute problem solving, she is now faced with another set of complex decisions to make. Amongst them, 1) Renting an apartment vs purchasing a flat; 2) What is the best transportation solution; 3) and whom to select for long overdue dental work.
In this case study, we will use selecting a DENTIST as the basis to illustrate the application of non-compensatory (full-dimensioned) and compensatory (single-dimensional) models for analyzing multi-attribute options to make decisions.
After calling many dentists in the Yellow Pages, Kathryn learns that only 4 dentists are accepting new patients. They are: Dr. Molar; Dr. Feelgood; Dr. Whoops and Dr. Pepper. Kathryn decided that her objectives in selecting a dentist will be high quality dental care at a reasonable cost, with minimum disruption to her schedule and as little (or no) pain as possible. Kathryn adopts these attributes as the outline to assist her in gathering data and making her final choice: 1) Reputation of the Dentist; 2) Cost Per Hour; 3) Available Office Hours; 4) Travel Distance; 5) Method of Anesthesia.
These attributes are independent and the one attribute cannot predict any of the others.
Kathryn collects data from interviewing the receptionist in each office, talking to client references, calling the local consumer complaints board, and from the Better Business Bureau. A summary of her findings is shown below.
Kathryn would prefer Novocain>Laughing Gas>Acupuncture>Hypnosis in that order, but does not like Hypnosis. Ideally, she would prefer to pay less than $60 per hour, not more than 30 KM from her home, preferring the dentist with the most office hours. The minimum acceptable quality is “Good”.
We are now asked to help Kathryn reach a decision through the use of both non-compensatory (full-dimensioned) and compensatory (single-dimensional) decision making models...
NON-COMPENSATORY MODEL Technique 1: Dominance...
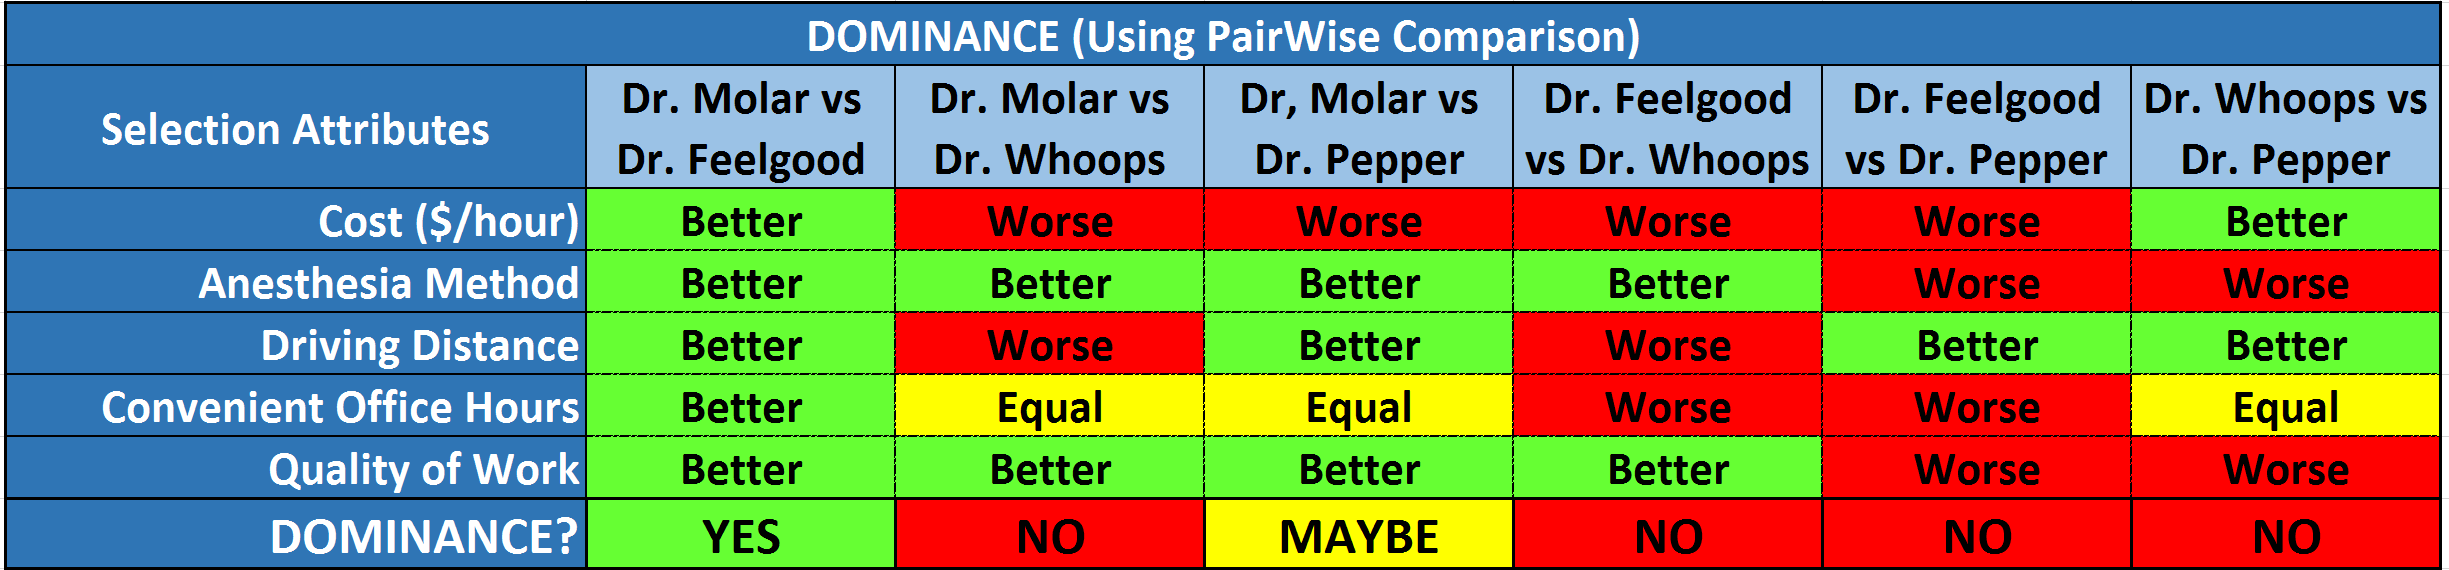
Figure 8 - Demonstrating the concept of DOMINANCE
Source: Sullivan, Wickes & Kroelling (2014) Engineering Economics 15th Edition
This method is pretty self-explanatory. Clearly Dr. Molar DOMINATES in early all categories, with the only other contender who is even close would be Dr. Pepper. What this approach assumes (which is often NOT the case) that all attributes are equally important.
NON-COMPENSATORY MODEL Technique 2: Satisficing...
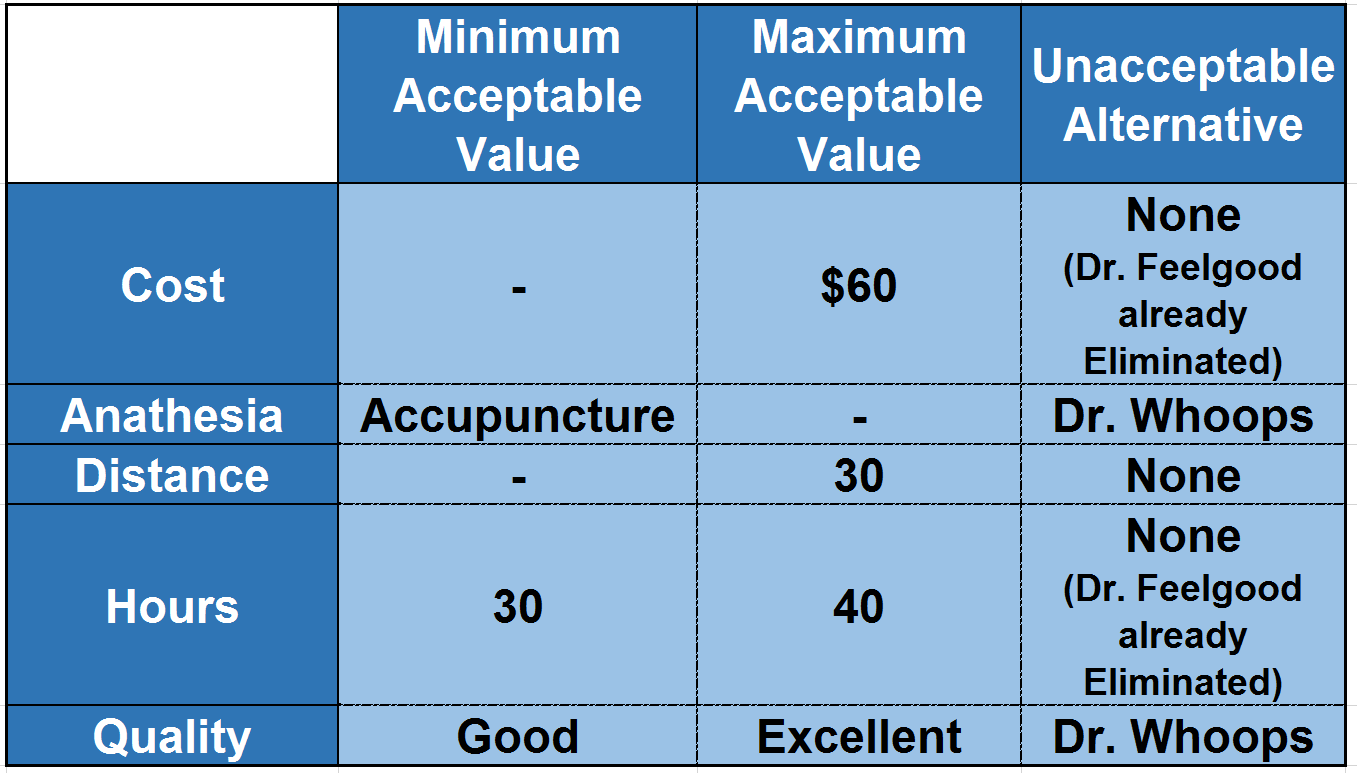
Figure 9 - Demonstrating the concept of SATISFICING
Source: Sullivan, Wickes & Kroelling (2014) Engineering Economics 15th Edition
Applying the concept of SATISFICING we pick the minimum and maximum acceptable values and eliminate those options which do not meet ALL of them at both ends of the spectrum. This serves to weed out any outliers, however it also serves to look at only those options which are marginally acceptable, eliminating the ability to look at extremes which may prove to be acceptable trade-offs. (i.e. in this case, you could find that the most expensive dentist also has the best quality as well, which may well be worth considering)
NON-COMPENSATORY MODEL Technique 3: Disjunctive Reasoning...
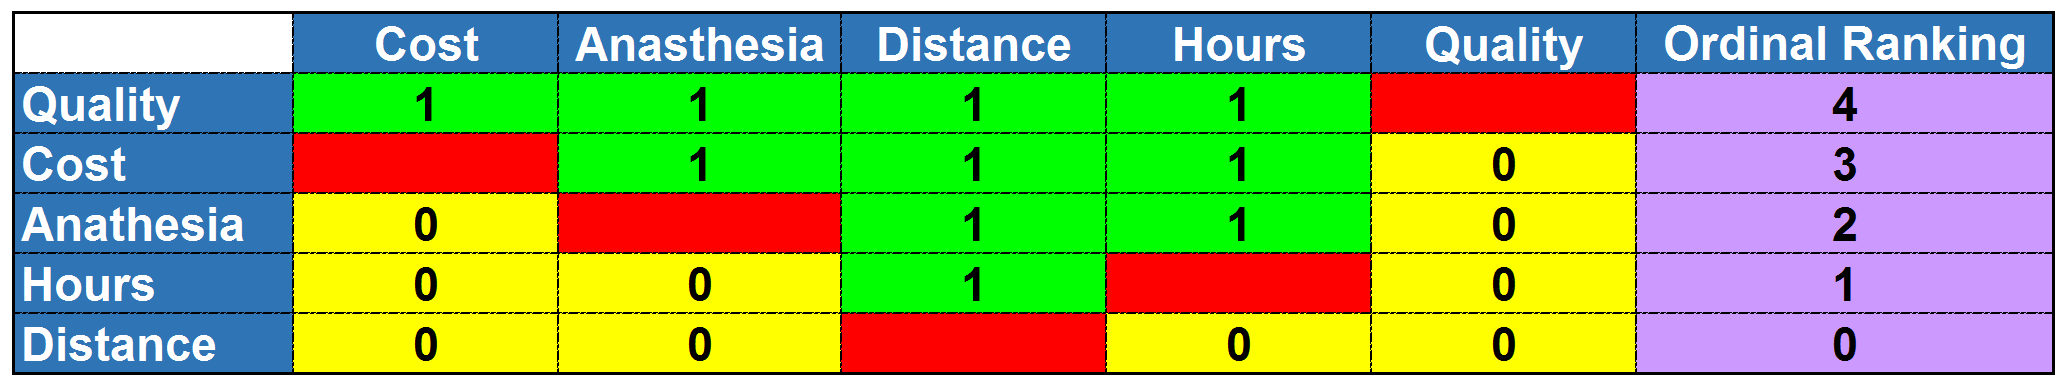
Figure 10 - Example of DISJUNCTIVE REASONING
Source: Sullivan, Wickes & Kroelling (2014) Engineering Economics 15th EditionUsing the approach, we take a look at all the attributes and conduct a Pair-Wise comparison to determine which attributes are the most important by asking “which is more important?” and we give a score of 1 to the winning option and a score of 0 to the losing option.
1) Cost or Anathesia? 2) Quality or Cost? 3) Cost or Distance? 4) Cost or Office Hours 5) Anaesthesia or Distance? 6) Anaesthesia or Office Hours 7) Quality or Anaesthesia? 8) Office Hours or Distance? 9) Quality or Distance? 10) Qualify or Office Hours?
Then we add up the number of times each attribute scores a 1 and that provides us with the relative importance of that attribute.
NON-COMPENSATORY MODEL Technique 4: Lexicography...

Figure 11 - How to Use LEXICOGRAPHY to make the “best” or “better” choice
Source: Sullivan, Wickes & Kroelling (2014) Engineering Economics 15th Edition
Using the rank ordering of attributes developed using Disjunctive Reasoning, we see that in terms of quality, which is Kathryn’s most important attribute, Dr. Molar is #1, followed by Dr. Pepper, Dr. Feelgood and Dr. Whoops.
In this example, Kathryn has:
1) Rank ordered the importance of her attributes from Quality being the most important (4) to Distance (0) being least important. 2) Then she rank ordered the dentists with Dr. Molar still dominating over Dr. Whoops, and Dr. Pepper looking like a potential “2nd choice” again.
COMPENSATORY MODELS
Using the non-compensatory models we really don’t have any way to really score the alternatives using a ratio scale. Meaning we can rank order them from best to worst but we are unable to measure how they SCORE RELATIVE TO ONE ANOTHER. In other words is the best option only 10% better than the other options or 50% better? To come up with a true ratio scale we have to start with a true zero point and all the increments need to be the same value.
COMPENSATORY MODEL Technique 1: Non-Dimensional Scaling Technique...
This is a two step process where we first have to turn the relative options into a “base 1” or dimensionless value.
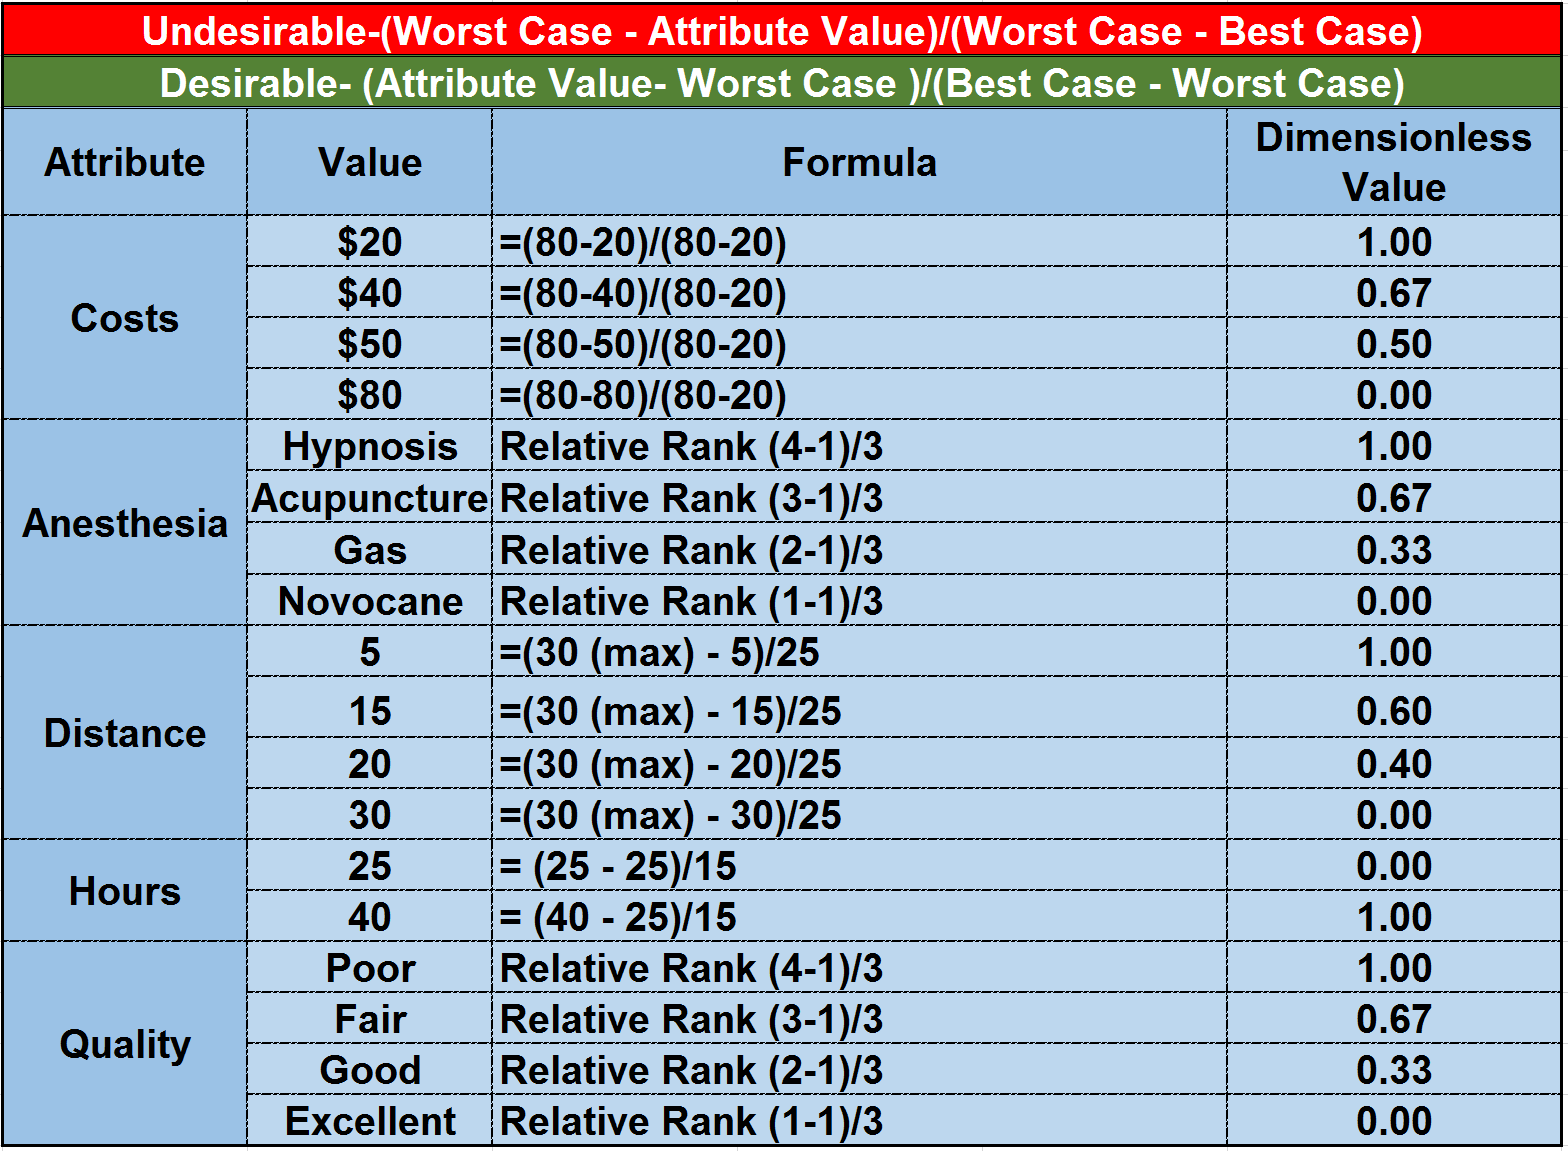
Figure 12 - Turning each option into a Base 1 (dimensionless) scoring model
Source: Sullivan, Wickes & Kroelling (2014) Engineering Economics 15th EditionThen the second step is to calculate the relative weighting of each attribute.
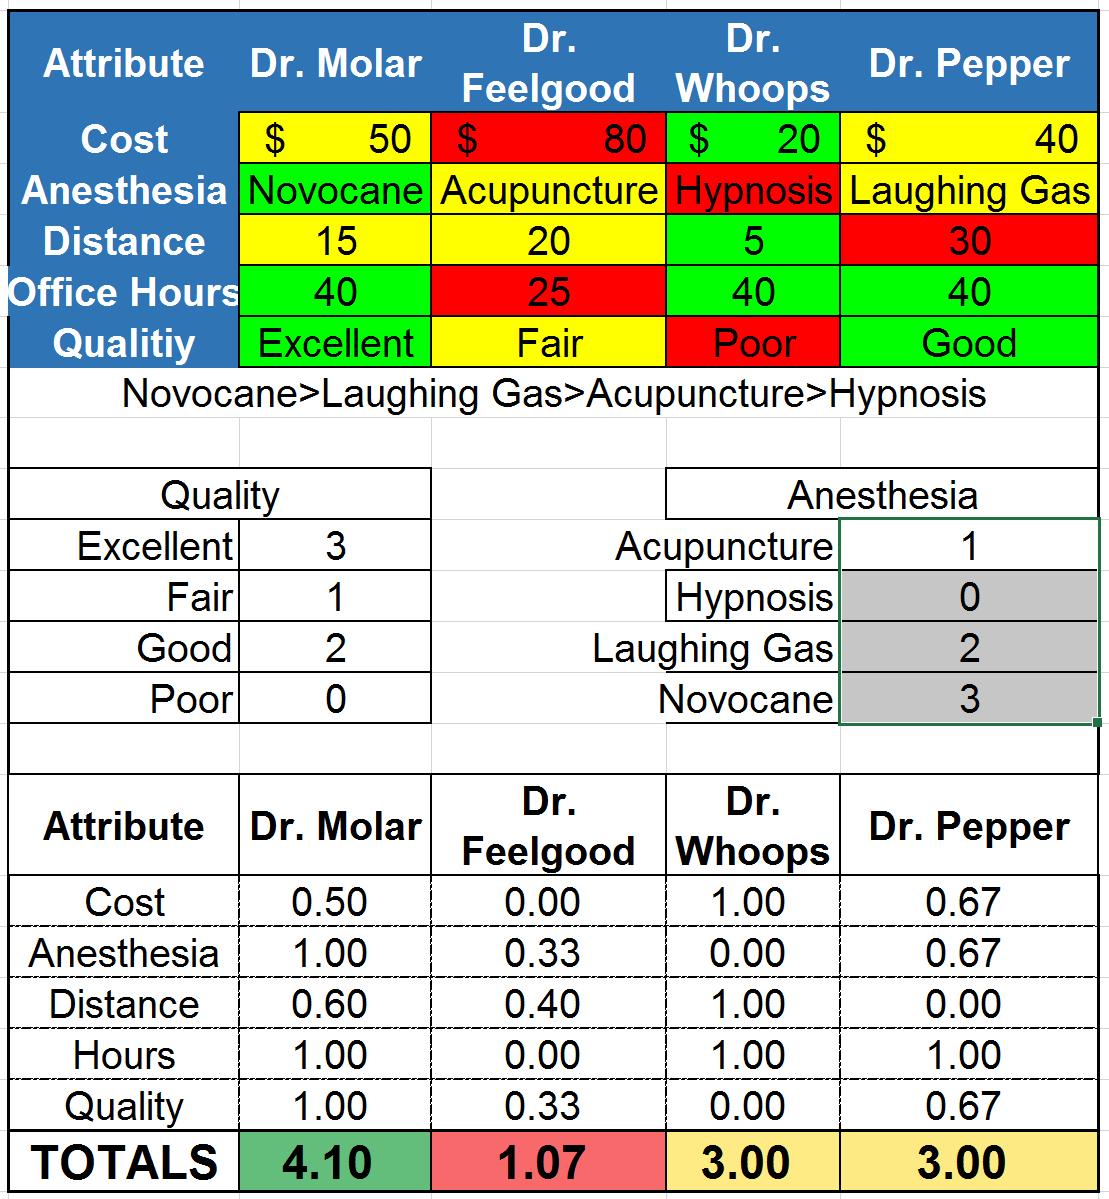
Figure 13 - Relative Weighting
Source: Sullivan, Wickes & Kroelling (2014) Engineering Economics 15th Edition
Applying this approach, we can see that Dr. Molar with a total score of 4.10 is 3.83 times “better” than Dr. Feelgood. (4.07/1.07 = 3.830) Likewise, with Dr. Whoops and Dr. Pepper tied at 3.0 each we know that Dr. Feelgood is about 37% “better” choice than either Dr. Whoops or Dr. Pepper.
This case study was created by Spreadsheet developed by James A. Alloway Jr., Ph.D. as it appears in Engineering Economy, 15th Edition (2006) by Sullivan, Wickes and Koelling, Chapter 14, Decision Making Considering Multi-Attributes.
COMPENSATORY MODEL Technique 2: Additive Weighting Technique...
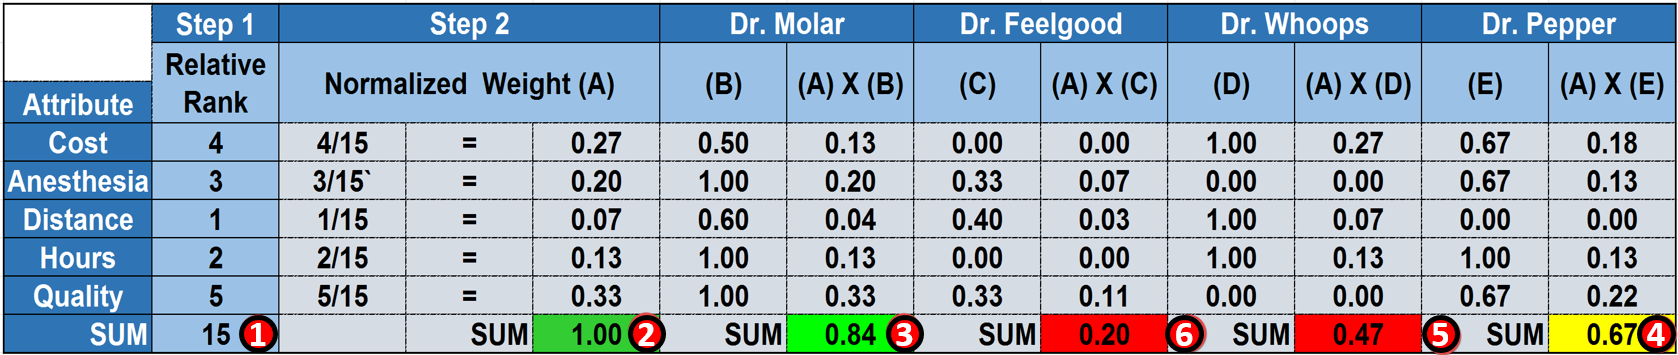
Figure 14 - Additive Weighting Technique
Source: Sullivan, Wickes & Kroelling (2014) Engineering Economics 15th Edition
This a very powerful decision making tool which not only has applications in assessing and managing change but in cost estimating as well.
This is a three step process:
(1) We have to add up the total of relative ranking of all options which comes out to be 15
(2) Then we normalize the weighting of each attribute which gives us a perfect score of 1.00. In other words the perfect choice would have to score a 1.00, and anything less than 1.00 requires some compromise or trade-off.
(3) We can see that while Dr. Molar was clearly the top scoring dentist with a score of 0.84, if we go back to our days in school, we know that is only a mid-level B. So the question is should Kathryn go out and explore more potential dentists or is she willing to accept a “B” dentist? Or should she consider adding more attributes to her assessment?
(4) Dr. Pepper, even though he was clearly a solid “ choice” in nearly all the analysis, clearly with a score of only 0.67 out of a possible 1.00, he really is only a “D” candidate.
(5) Dr. Whoops with a score of only 0.47 is a “failure” at least in the context of Kathryn’s requirements and
(6) Dr. Feelgood is clearly the inferior option
While this seems like a lot of work to learn these tools and techniques, learning them will help you become a much more professional project controls practitioner as you will be able to facilitate your team in making tough decisions in a way which can be quantified for presentation to management in helping them “better” if not “the best” decision under conditions of uncertainty.
For more on using Multi-Attribute Decision Making, below are additional references:
- in addition to the highly recommended “Engineering Economy- 15th Edition” by Sullivan Wickes and Koelling http://www.amazon.com/Engineering-Economy-15th-William-Sullivan/dp/0132…
- Non-compensatory (and Compensatory) Models of Consideration-Set Decisions John R. Hauser, Min Ding, and Steven P. Gaskin http://www.mit.edu/~hauser/Papers/Hauser_Ding_Gaskin_Sawtooth_Considera…
- A Study of the Compensatory and Non-Compensatory Decision Support on the Top-100 U.S. E-Commerce Websites Naveen Gudigantala http://www.na-businesspress.com/JABE/GudigantalaN_Web16_1_.pdf
10.3.4 OUTPUTS
- Scope Definition Down To Level 3 Or Preferably Level 4 Before Execution Starts
- Approved Performance Measurement Baseline In Place
- Approved Or Rejected Change Orders
- Minimized Change Orders, Disputes And Claims
10.3.5 REFERENCES & TEMPLATES
Building information modeling (bim)
- https://thebimhub.com/
- https://www.youtube.com/watch?v=do2vm22ocm4
- https://www.youtube.com/watch?v=c2jh6xoveqc
- https://www.youtube.com/watch?v=ubrjrmgi3uk
- http://www.samedcpost.org/docs/presentation_bim_031611.pdf
Integrated Project Delivery (IPD)
- http://www.aia.org/aiaucmp/groups/aia/documents/pdf/aiab083423.pdf
- http://www.aia.org/about/initiatives/aias076981
- http://ipdfl.net/
Cost Benefit Analysis
- http://www.wikihow.com/do-a-cost-analysis
- http://www.agecon.purdue.edu/staff/shively/courses/agec406/reviews/bca…
- http://ag.arizona.edu/classes/rnr485/ch5.htm
Internal Change Order Templates
- http://www2.cit.cornell.edu/computer/robohelp/cpmm/cpmm_internalchgord1…
- http://www.osec.doc.gov/ofm/oap/ppmtd/documents/ppm_td_forms/doc_intern…
- http://www.qcert.org/sites/default/files/public/documents/giap-template…
10.4 - Module 10-4 - Managing Change - The Contractor’s Perspective
10.5 - Module 10-5 - Configuration Management
GPCCAR M10-3, Revision 1.02