07.0 - MANAGING PLANNNING & SCHEDULING
07.1 - Module 07-1 - Introduction to Managing Planning & Scheduling
07.2 - Module 07-2 - Develop the Planning & Scheduling Policies & Procedures Manual
07.3 - Module 07-3 - Identify / Capture all Schedule Activities
07.4 - Module 07-4 - Create the Logical Relationships & Sequence Activities
07.5 - Module 07-5 - Assigning Resources to all Activities
07.6 - Module 07-6 - Calculate the Duration of Each Activity
07.7 - MODULE 07-7 - CALCULATING FLOAT AND THE CRITICAL PATH
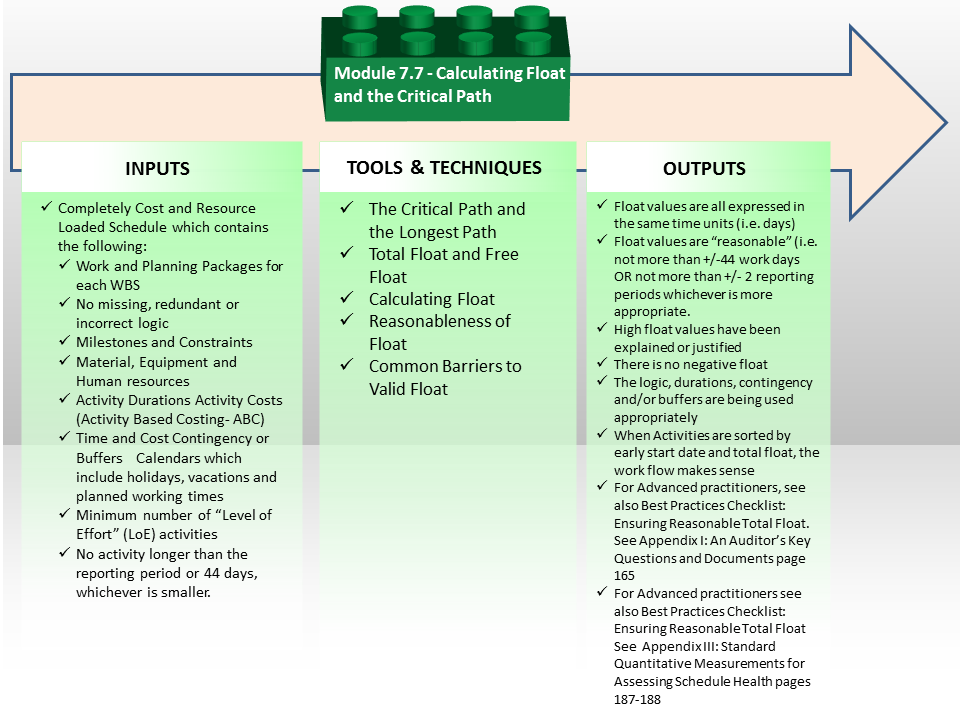
Figure 1 - Calculate the Critical Path & Float Process Map
Source: Guild of Project Controls
07.7.1 INTRODUCTION
Whilst much of what is described below can be done “by hand” and “on paper” by manually drawing a network diagram, logical links between activities, and manually calculating start and finish dates, it is recognized that since the introduction of project controls software solutions, a “computer simulation” is now generally accepted to be an integral part of the scheduling process. For this, schedulers often utilize software to assist in “the drawing” of their network diagrams and creation and usage of their schedules.
Most of today’s software systems allow the creation of schedules using a “Network View” to show and create activities and logical relationships and a “Bar Chart View” or “Gantt Chart View” to show bar-lines and logical relationships.
It is recommended that a proficient planner or scheduler should still be able to demonstrate how to create a critical path network diagram “by hand” and “on paper” in order to fully understand the concepts described below.
07.7.2 INPUTS
Completely Cost And Resource Loaded Schedule Which Contains The Following:
- Work And Planning Packages For Each WBS Element (100% Of Necessary Activities)
- No Missing, Redundant Or Incorrect Logic
- Milestones And Constraints
- Material, Equipment And Manpower Resources
- Activity Durations Which Are Realistic And Achievable
- Activity Costs (Activity Based Costing- ABC)
- Time And Cost Contingency Or Buffers Appropriate To The Riskiness Of The Project, Work Package And/Or Activity
- Calendars Which Include Holidays, Vacations And Planned Working Timesminimum Number Of “Level Of Effort” (LOE) Activities
- No Activity Longer Than The Reporting Period Or 44 Days, Whichever Is Smaller unless otherwise justified
07.7.3 TOOLS & TECHNIQUES
07.7.3.1 The Critical Path and the Longest Path
The Critical Path Method (CPM) calculates the longest path of planned activities to the end of the network, and the earliest and latest that each activity can start and finish prolonging the network’s calculated completion.
Since the activity durations, calculated from quantities and production rates, provide single values instead of a range, CPM is called Deterministic Scheduling.
CPM calculates project schedule and activity floats basing on the network logic, activity calendars and any constraints but ignores resource, supplies, space and funding constraints etc.
This CPM process determines which activities are "critical" (residing on the longest path of activities) and which have "float" (the amount of time an activity can be delayed without extending the project duration).
07.7.3.2 Definitions of Total Float and Free Float
Here are the definitions for the two types of schedule float:
- Total Float (TF) = the maximum amount of time an activity can be delayed from its early start without delaying the entire project.
- Late Date – Early Date = Total Float.
- Explained more simply Total Float is the range an activity can slip or be pushed forward without affecting the end date of the project.
- Free Float (FF) = the maximum amount of time an activity can be delayed without delaying the early start of any of its succeeding activities.
- Explained another way, Free Float is the range an activity can slip or be pushed forward without affecting the start of any activity after it.
07.7.3.3 Calculating Float
A critical path is the sequence of activities which add up to the longest overall duration and this determines the shortest possible time necessary to complete the project. How do we calculate the Critical Path and thus "Float"?
It doesn’t matter which of the software packages we use or even if we calculate the schedule by hand, there are three steps we use.
- We conduct a FORWARD PASS which determines the EARLY dates;
- Then we conduct a BACKWARDS PASS which calculates the LATE DATES.
- Then we subtract the EARLY DATES from the LATE DATES which gives us TOTAL FLOAT.
- There will be a calculation for EARLY DATE FLOAT
- There will be another calculation showing LATE DATE FLOAT
- It is possible to have DIFFERENT VALUES for Early Date Float and Late Date Float.
- IF the Late Date Float is a LARGER value than the Early Date Float, we deduct the smaller number from the larger number that is known as LATE DATE FREE FLOAT
- IF the Early Date Float is LARGER than the Late Date Float then we subtract the smaller number from the larger number and that gives us EARLY DATE FREE FLOAT
- Total Float can also be a negative value in which case it is known as NEGATIVE FLOAT.
- Total Float belongs to an entire STRING of activities.
- Free Float belongs to only a single activity
Note - A predecessor should schedule earlier than the successor and a successor depends on the performance of the predecessor.
- DO THE FORWARD PASS CALCULATION’S FIRST
The aim is to determine “early start” and “early finish” dates for each activity so we move from the project start date forward and define the earliest possible dates (start and finish) for each activity; i.e. the Forward Pass.
Given that we have no imposed finish date we can utilise the activity durations to determine the early start (ES) and early finish (EF) of each activity:
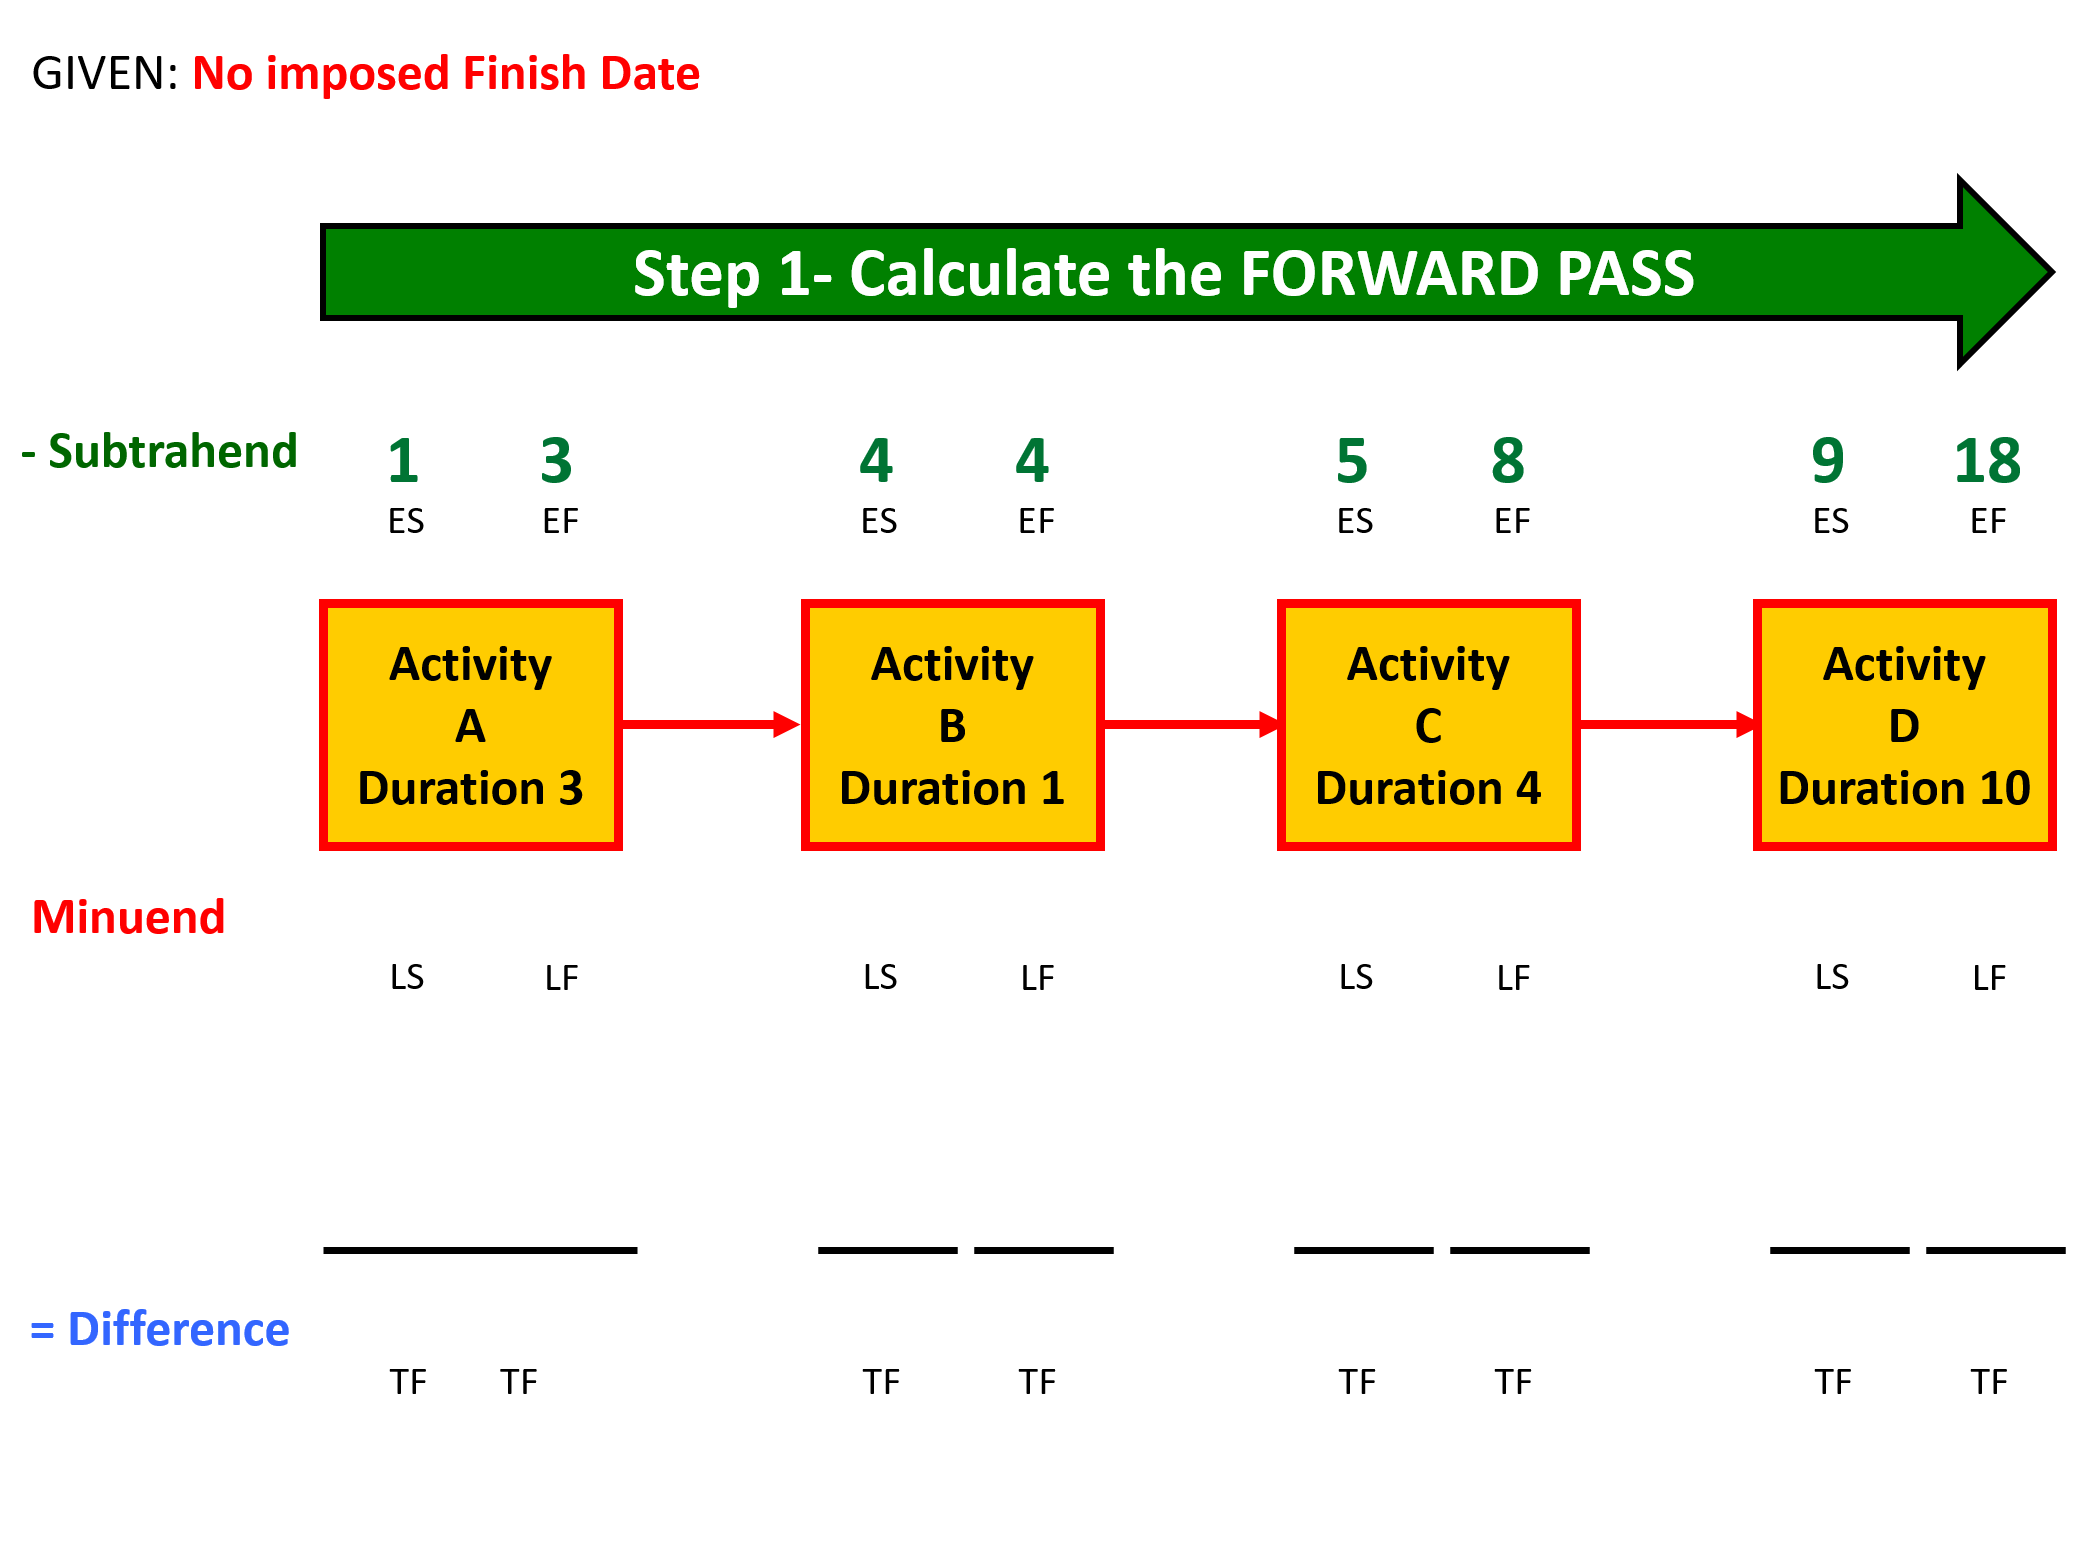
Figure 2 - The Forward Pass Calculations
Source: Giammalvo, Paul D (2015) Course Materials. Contributed Under Creative Commons License BY v 4.0
Explanation for Calculating EARLY DATES (ES and EF):
- Activity A is 3 days long. It starts on the morning of day 1 and work proceeds for three days, ending at close of business on day 3.
- Activity B is one day long and work starts on the morning of day 4 and being one day long, finishes at the close of business on day 4.
- Activity C is 4 days long, starting on the morning of day 5 and continuing until close of business on day 8.
- Likewise, Activity D, which is 10 days long, starts the morning of day 9 and finishes close of business on day 18.
- DO THE BACKWARDS PASS CALCULATION’S SECOND
The aim is to determine late start (LS) and late finish (LF) dates for each activity so we move backward from the early project finish date as defined by the Forward Pass calculations in the previous step; i.e. the Backward Pass.
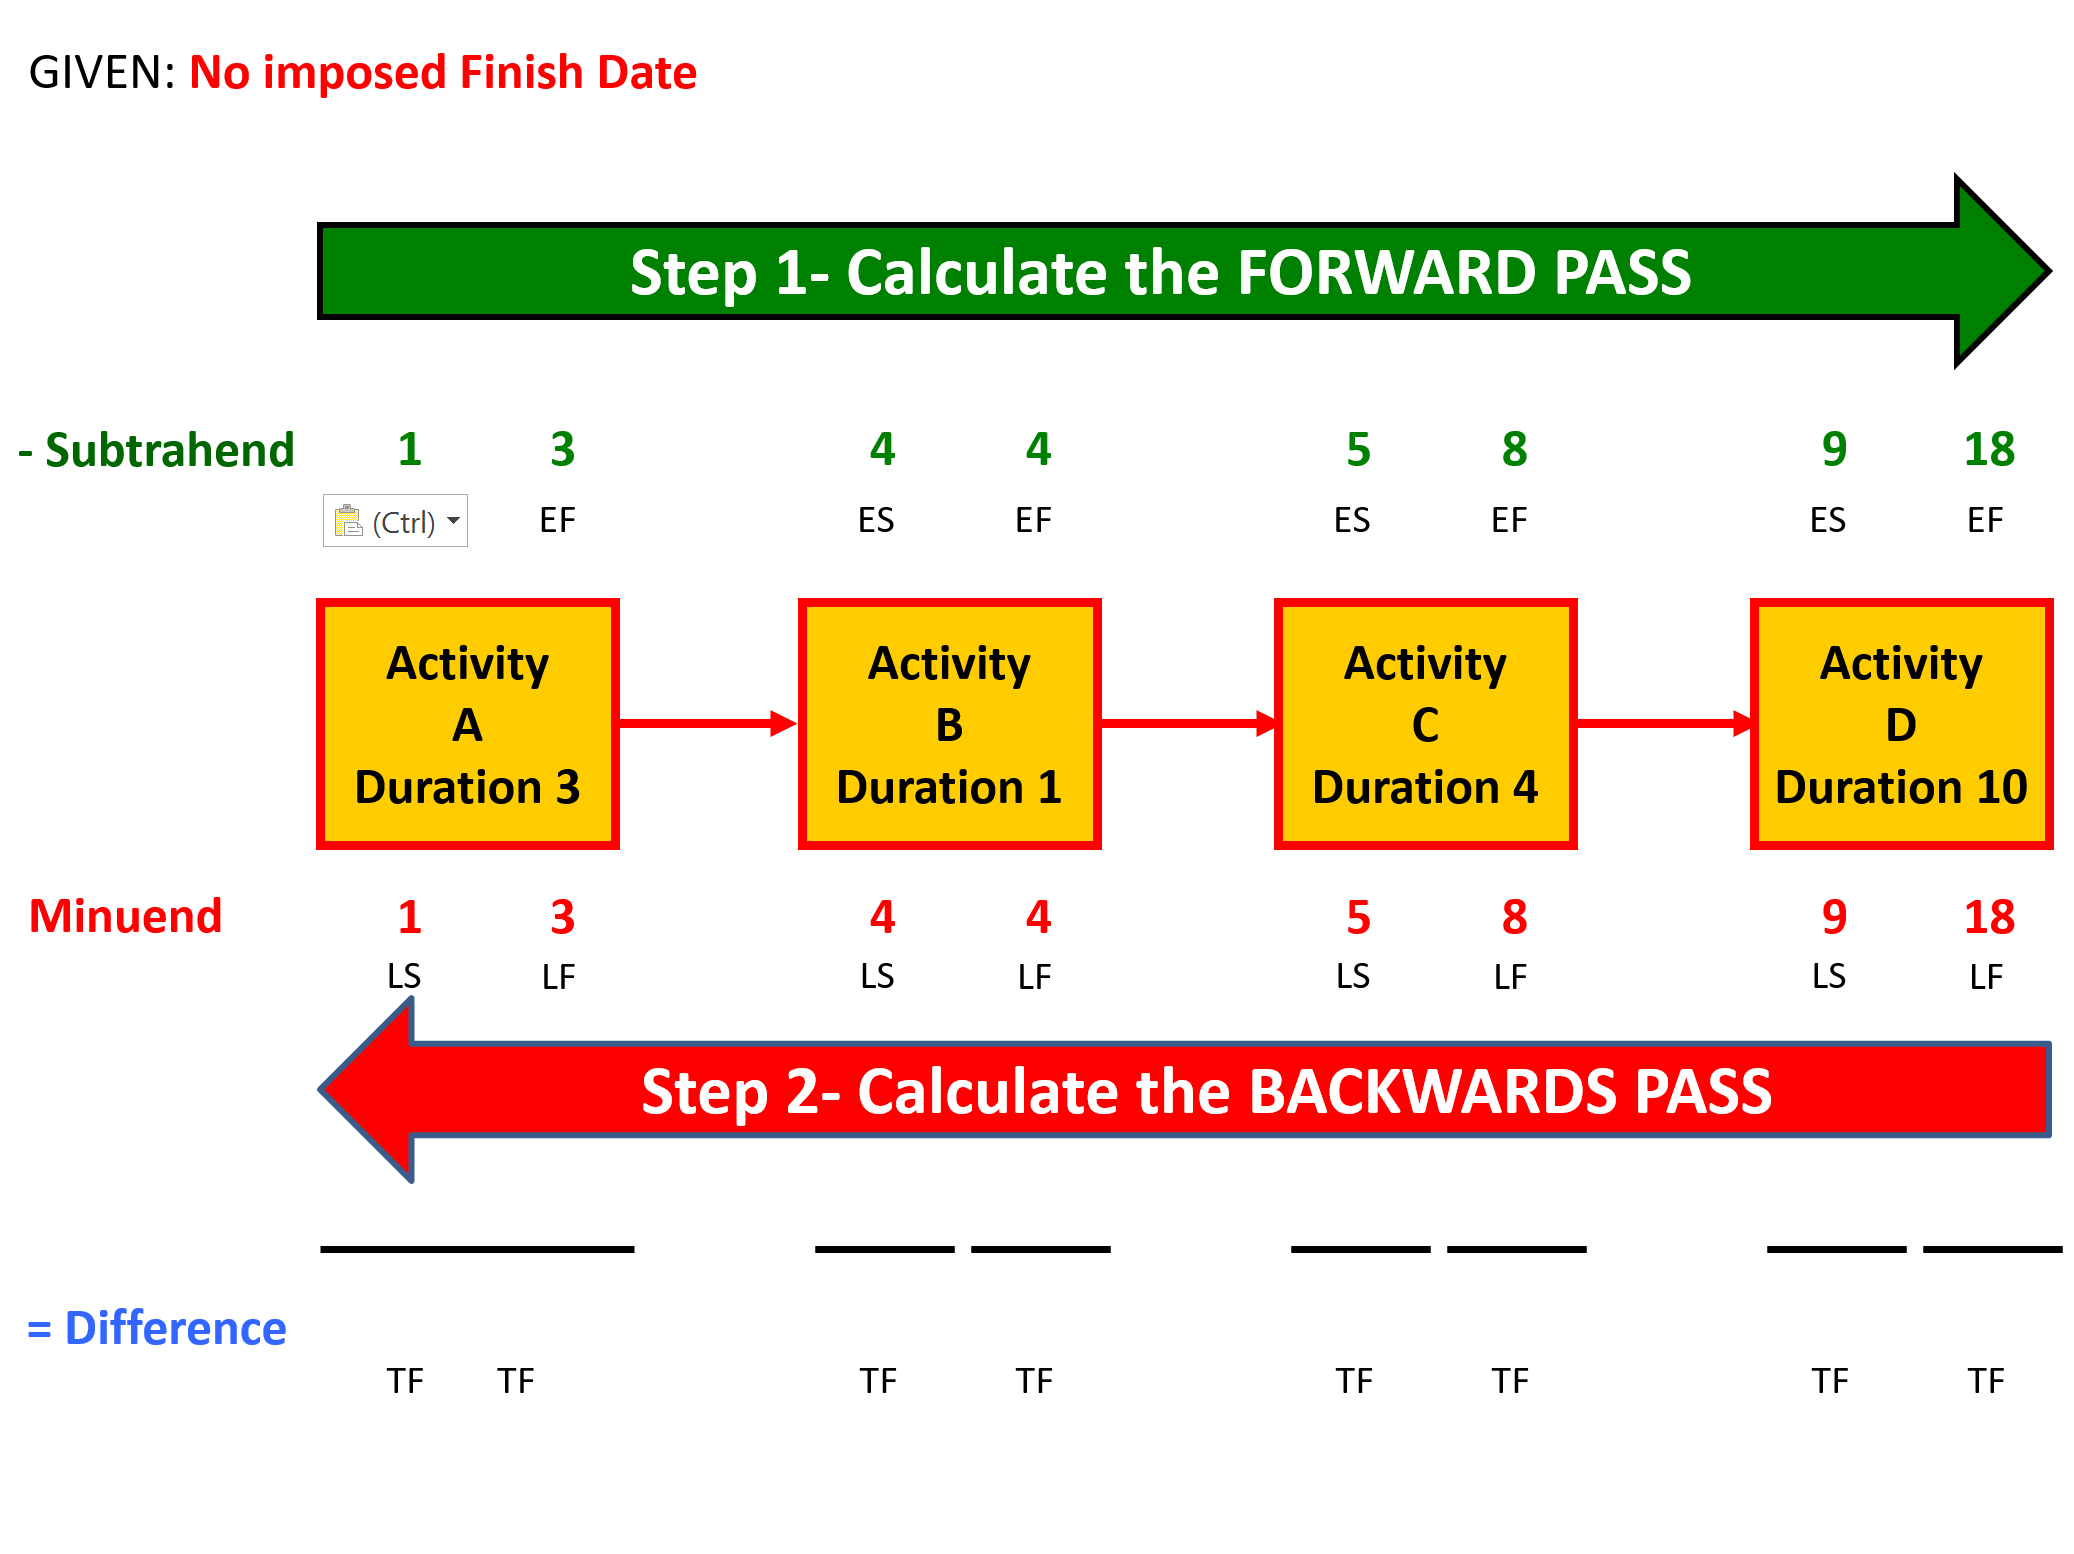
Figure 3 - The Backward Pass Calculations
Source: Giammalvo, Paul D (2015) Course Materials. Contributed Under Creative Commons License BY v 4.0
Given we have no imposed finish date, the program looks to see what is the LONGEST PATH (the activity which has the highest early date value)
Explanation for Calculating LATE DATES (LS and LF):
In this case, the number is 18 and we use that to start working BACKWARDS.
- Activity D finishes on day 18 and working backwards, means the START of Activity D was the morning of day 9.
- Again working backwards that means Activity C had to FINISH at the close of business on day 8 and start the morning of day 4.
- Activity B finished close of business on day 4 and as it was only one day long, started that same morning.
- Likewise, Activity A finished close of business on day 3 and would need to start on the morning of day 1.
- CALCULATE THE TOTAL FLOAT
The aim is to determine the Total Float (TF) for each activity.
Activity Total Float is the number of working periods (in weeks, days, hours etc.) from its Early Start to the Late Start or Early Finish to the Late Finish.
Activities with zero Total Float are called “Critical Path Activities”.

Figure 4 - Calculating the Early Date and Late Date Total Float and Critical Path
Source: Giammalvo, Paul D (2015) Course Materials. Contributed Under Creative Commons License BY v 4.0
Explanation for Calculating TOTAL FLOAT (TF):
- The final step is we subtract the EARLY DATES from the LATE DATES which gives us TOTAL FLOAT (which for some vague reason having to do with Navy tradition), Professor Fondahl put on the top of the boxes when if we were to follow standard mathematical convention, as the subtrahend, should have gone on the bottom of the boxes.
- But that detail aside, As you can see, when you deduct the early dates from the late dates, you get the TOTAL FLOAT.
- Deducting the Early Start from the Late Start gives you EARLY DATE TOTAL FLOAT while deducting the Late Start from the Late Finish yields the LATE DATE TOTAL FLOAT.
- Lastly, as, you see that the total float for all 4 activities is 0, and this is the LONGEST PATH through this project and represents the SHORTEST AMOUNT OF TIME it can be completed in, which means all 4 activities are on the critical path.
It also means that a delay to any one of those 4 activities delays the finish of the project by that same amount of time.
- WHAT HAPPENS WHEN WE IMPOSE A FINISH DATE
(BY EITHER CONSTRAINING THE LAST ACTIVITY TO A "MUST FINISH ON" OR SET THE PROJECT COMPLETION DATE IN THE SOFTWARE PROGRAM)
Now we can see that the forward pass remains identical to the previous calculations, but now on the backwards pass, instead of starting a day 18, we start at day 24 and performing the same set of calculations we did in the previous example, arrive at Activity A starting the morning of day 7.
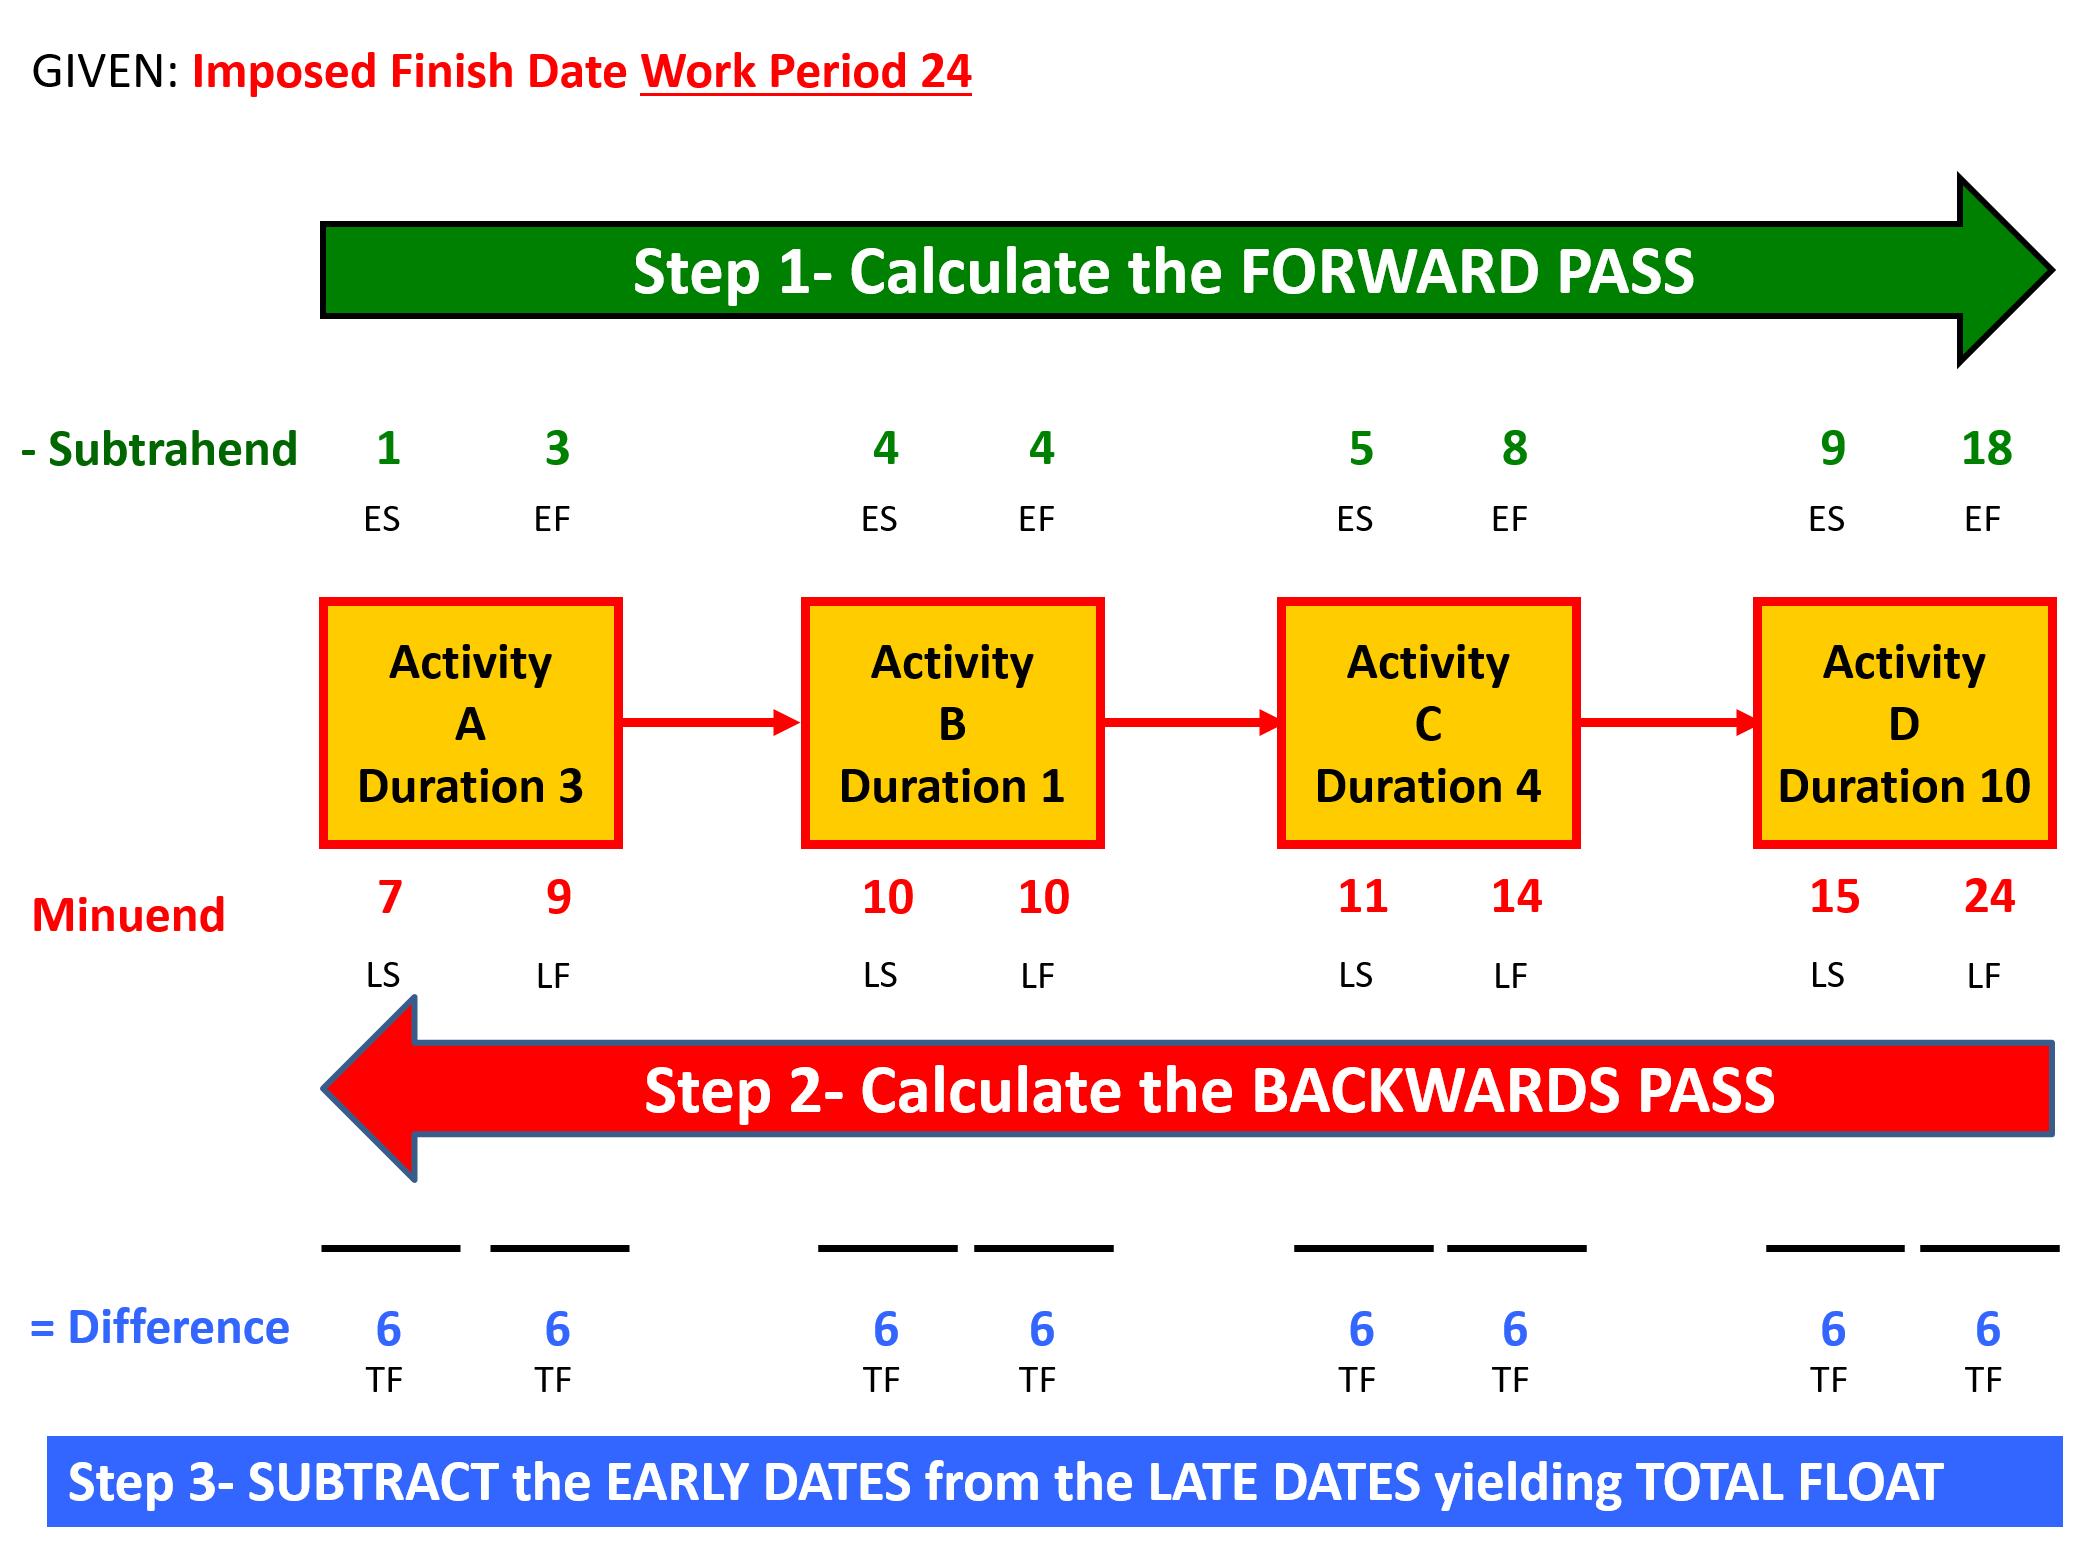
Figure 5 - Calculating the Critical Path With Imposed Completion
Source: Giammalvo, Paul D (2015) Course Materials. Contributed Under Creative Commons License BY v 4.0
When we deduct the early dates from the late dates, again we see we came up with 6 days total float. But notice- even though each activity shows there are 6 days of total float, each activity does not have all 6 days. What we need to know is that TOTAL FLOAT IS SHARED between all the activities in the string. Which means if any one of those activities uses up all 6 days, then it is gone for all the other activities to use.
This is one reason schedulers should be very cautious about showing total float on any reports, as people see the total float and think it belongs to them, when in fact it does not. Float that is owned by one activity and one activity alone is called FREE FLOAT and the only way you will get free float is when the early date float and the late date float values are different and the only way that happens is when you have Start to Start and Finish to Finish relationships in your schedule.
If all you have are Finish to Start relationships, then your Early Date (ED) and Late Date (LD) total float values will always be the same . Using the most common software packages, the only time it is possible for you to get different values for the ED Total Float and LD Total float is if you add in SS or FF relationships.
- WHAT IS NEGATIVE FLOAT AND HOW DOES IT HAPPEN?
Management came back to us and said, wait, we now need this project done by day 12, not day 24. Once again the forward pass remains unchanged, and as before we start the backwards pass using the CONSTRAINED DATE but this time instead of day 24, management tells us now that it is day 12.

Figure 6 - Calculating the Critical Path With Negative Float
Source: Giammalvo, Paul D (2015) Course Materials. Contributed Under Creative Commons License BY v 4.0
So just as in the previous example, we start counting backwards from day 12, but when we do this, we have to make sure that we count day 0 as a placeholder, otherwise our total float values will be off by one day.
And as done previously, we see that both the early and late date total float is -6 days. This is known as “NEGATIVE FLOAT” and unfortunately, is an all too common occurrence on many projects.
Management wants us to do 18 days of work in only 12 days. As this is an impossible situation, then we MUST make it go away otherwise our project will finish not on day 12 as management wants but on day 18.
But we know there are 4 possible solutions to this problem:
- IGNORE IT - For those who don’t look for negative float or ignore it, will find that despite what management wants, without taking action this project will finish on day 18.
- CRASHING - We can add more resources to one or more of these activities, however given the budget was based on a certain amount of resources, if we add more, then surely the costs will increase.
- FAST TRACKING - If is it possible (and it may or may not be) instead of using Finish to Start relationships, maybe we can use Start to Start and work one or more of these activities in parallel?
- DESCOPING - If management or the client doesn’t object, then reducing the scope of work can help eliminate negative float. However it is always a last resort and one that only works in limited applications.
07.7.3.4 Multiple Paths
The above examples were intentionally simplified to ensure that everyone knows and understands how to calculate the forward and backwards passes and use those numbers to generate total float values. But in real life, there are not one path but multiple paths.
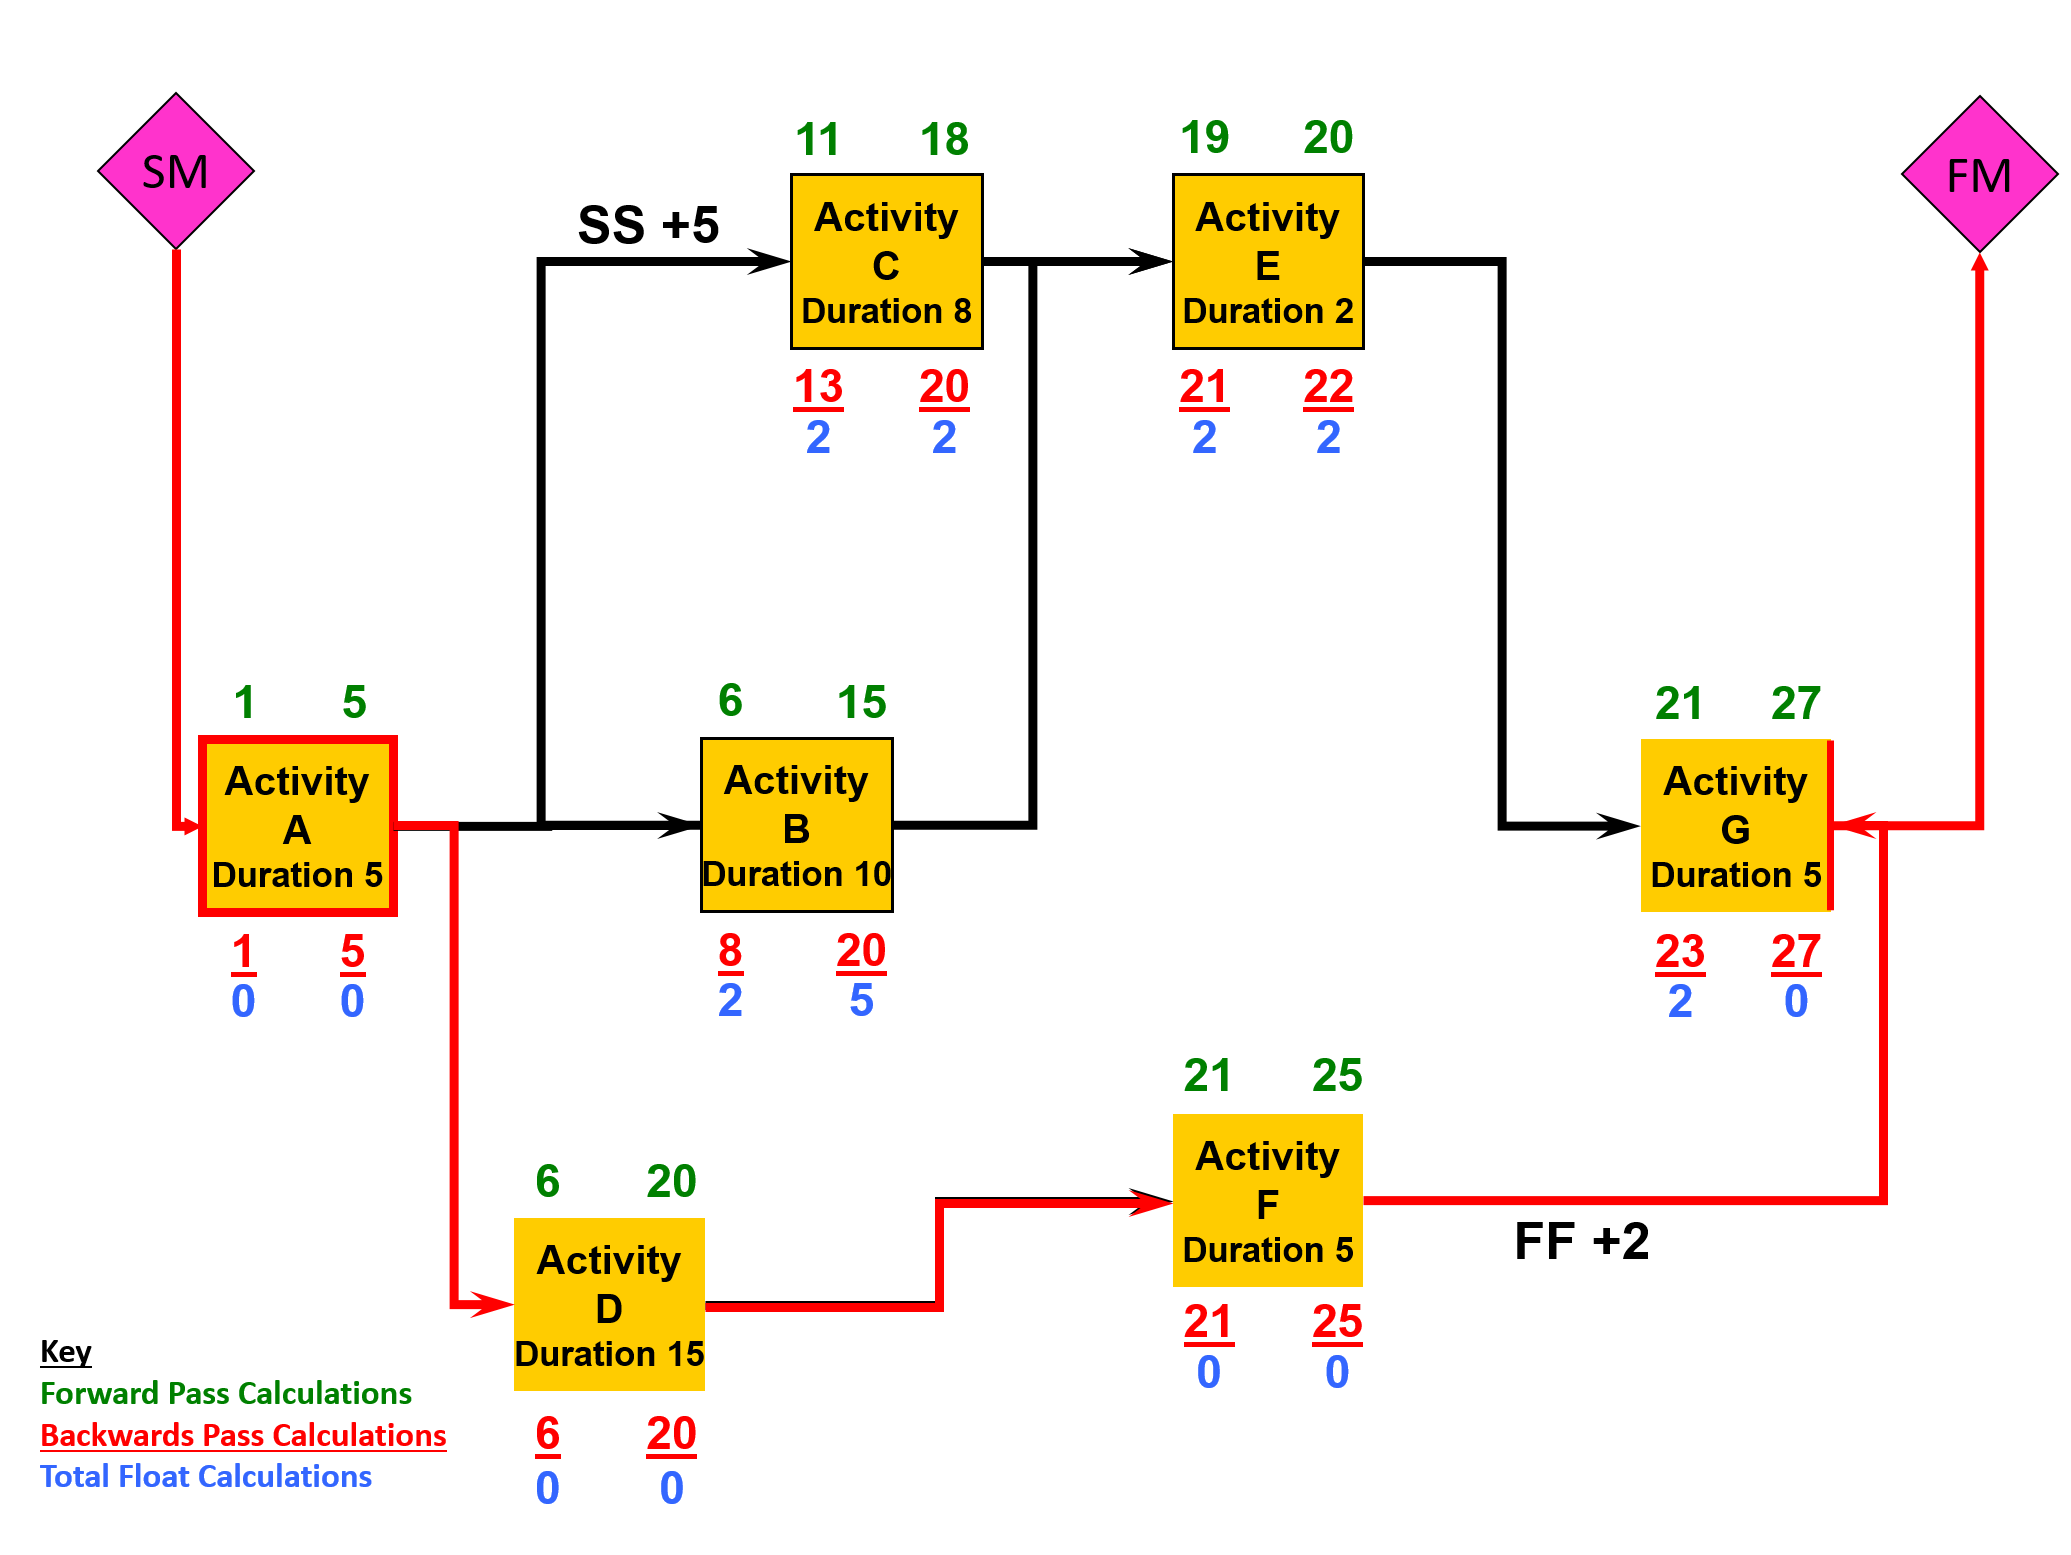
Figure 7 - More Complex Model Showing Multiple Activity Strings, Total Float and Free Float
Source: Giammalvo, Paul D (2015) Course Materials. Contributed Under Creative Commons License BY v 4.0
Using the same conventions as above, with the EARLY DATES (Green) on top of the boxes and LATE DATES (Red) on the bottom of the boxes and the TOTAL FLOAT (Blue) we can see:
- that string A, D, F and the Finish of G are on the CRITICAL PATH.
- that Activity B, C, D and the beginning of Activity G all show 2 days of TOTAL FLOAT which as we know from our examples above is SHARED between all 4 activities.
Note however that the Late Date Float of Activity B shows 5 days, 2 of which we know to be Total Float. So what does that mean? It means that Activity B has 3 days of FREE FLOAT that belong to Activity B and Activity B alone.
How do we use it?
Both Activity B and Activity D start on the morning of Day 6, and we know that because Activity D is on the critical path that any delay to activity on the critical path delays the completion date of the project by that amount of time. So we start to monitor the actual productivity on Activity D and we find out that it is LESS than what was estimated. So assuming that any resource can work on any task (which may or may not be true) where can we get additional resources WITHOUT increasing the cost OR increasing the risk by creating multiple critical paths?
And the answer is Activity B. We can actually REDUCE the resources on Activity B by ~30% thus increasing the duration from 10 days to 13 days without impacting the total float on any other activity and without having to add resources to the project.
07.7.3.5 Reasonableness of Float
- To be considered "reasonable" float cannot be negative nor can it be too high.
A common “rule of thumb” is that float should be no longer than 2 reporting periods OR 44 days, whichever is shorter - unless a logcal and valid explanation can be made justifying higher float values. If it is longer, then it needs to be looked at to see first if the logic is correct.
- Often an activity with large amounts of float has been scheduled too early in the process. A typical example would be landscaping; while technically it can start as soon as the outside of the structure has been enclosed, there are often practical (discretionary) reasons why it could or should be delayed.
- Perhaps because of weather or simply because we want to leave the landscaping until after as much work as possible has been completed, to avoid any danger of having to drive equipment over pavements or sidewalks or seeded areas and as such Landscaping would be initially planned after activities that use an equipment that can danger sidewalks or seeded areas, or be an “as late as possible” (ALAP) activity.
One of the dangers to be looking for is there should be a single contiguous path through the schedule of activities with zero total float.
In other words, ideally, there should be one and only one critical path which identifies the chain of activities which represents the longest path of work through the project.
Explained another way, this chain of logically linked activities represents the shortest possible time the project can be completed, given the resources and other constraints.
07.7.4 OUTPUTS
- Float Values Are All Expressed In The Same Time Units (I.E. Days)
- Float Values “Reasonable” (I.E. Not More Than +/-44 Work Days Or Not More Than +/- 2 Reporting Periods Whichever Is More Appropriate.
- High Float Values Have Been Explained Or Justified
- There Is No Negative Float
- The Logic, Durations, Contingency And/Or Buffers Are Being Used Appropriately
- When Activities Are Sorted By Early Start Date And Total Float, The Work Flow Makes Sense
- For Advanced Practitioners, See Also Best Practices Checklist: Ensuring Reasonable Total Float. See Appendix I: An Auditor’s Key Questions And Documents
- For Advanced Practitioners See Also Best Practices Checklist: Ensuring Reasonable Total Float See Appendix Iii: Standard Quantitative Measurements For Assessing Schedule Health
Best Practices Checklist: Calculating Float and the Critical Path: (Adapted from GAO “Best Practices in Scheduling”)
- The total float values calculated by the scheduling software are reasonable and accurately reflect true schedule flexibility.
- The project really has the amount of schedule flexibility indicated by the levels of float.
- Remaining activities in the schedule are sorted by total float and assessed for reasonableness. Any activities that appear to have a great deal of float are examined for missing or incomplete logic.
- Total float values that appear to be excessive are documented to show that the project team has performed the assessment and agreed that the logic and float are consistent with the plan.
- Total float is calculated to the main deliveries and milestones as well as to the project completion.
- Total and free float inform management as to which activities can be reassigned resources in order to mitigate slips in other activities.
- Management balances the use of float with the fact that total float is shared along a path of activities.
- Periodic reports routinely show the amount of float consumed in a period and remaining on the critical and near-critical paths.
- Date constraints causing negative float have been justified. If delay is significant, plans to recover the implied schedule slip have been evaluated and implemented, if so decided.
07.7.5 REFERENCES & TEMPLATES
- GAO “Best Practices In Scheduling”
- GAO "Cost Estimating And Assessment Guide Best Practices For Developing And Managing Capital Program Costs"
07.8 - Module 07-8 - Validate the Critical Path & Completed Dates
07.9 - Module 07-9 - Validating Horizontal & Vertical Integration
07.10 - Module 07-10 - Conducting a Schedule Risk Analysis
07.11 - Module 07-11 - Baselining & Communicating the Schedule
GPCCAR M07-7, Revision 1.02