Website Upgrade Incoming - we're working on a new look (and speed!) standby while we deliver the project

Tips on using this forum..

(1) Explain your problem, don't simply post "This isn't working". What were you doing when you faced the problem? What have you tried to resolve - did you look for a solution using "Search" ? Has it happened just once or several times?

(2) It's also good to get feedback when a solution is found, return to the original post to explain how it was resolved so that more people can also use the results.
P6- In a 2 shift manhour distribution not seen.

No replies
Ahmed A.
User offline. Last seen 12 years 49 weeks ago. Offline
Joined: 29 Nov 2010
Posts: 8

174
p6.gif
Dear All,

I prepared the schedule for a shutdown & loaded with resources.Unit of time used is Hrs. & the calender used is 24/7.

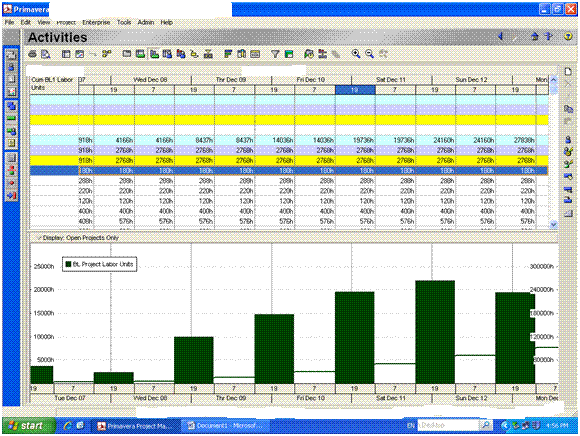
I wanted to view the activity distribution over the project time in 2 shifts,I selected the spread sheet on the top screen and the graph at bottom screen.
I selected the timescale>>Date Interval as Day/Shift>>Shift Calender as 2shift shutdown).
Now, I can see distribution of Manhours in Spread sheet in 2 shifts (in p6) BUT I cannot see the same distrubution in graph.In graph, I can only see the bar on only one shift and the other shift is shown blank ( there is no bar on the other shift).
 

In the picture you can see the bar on 19 (shift) & no bar on 7 (shift)


Waiting for your usual support.Thanks a lot in advance.