Website Upgrade Incoming - we're working on a new look (and speed!) standby while we deliver the project

Tips on using this forum..

(1) Explain your problem, don't simply post "This isn't working". What were you doing when you faced the problem? What have you tried to resolve - did you look for a solution using "Search" ? Has it happened just once or several times?

(2) It's also good to get feedback when a solution is found, return to the original post to explain how it was resolved so that more people can also use the results.
how does manpower histogram work

13 replies [Last post]
zahid shaikh
User offline. Last seen 5 years 45 weeks ago. Offline
Joined: 24 Aug 2016
Posts: 35

4402
capture-60_-_copy.png

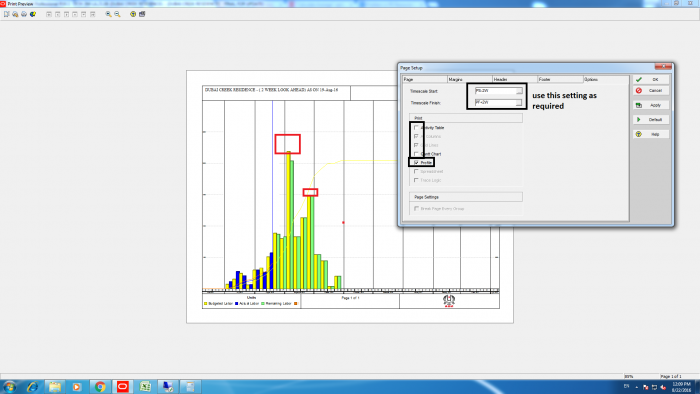
is there a way to show manpower in the red marked zone like in excel and also what is the proper way to set the resource histogram. it would make clear decsription how much man is actually there

Replies

Dear David,

I still don't understand how Excel can help to distinguish between one resource unit assigned for 100% of work time, two resource units assigned for 50% of their work time, four resource units assigned for 25% of their work time when only total resource hours are assigned and known.

Please clarify,

Regards,

Vladimir

Rafael Davila
User offline. Last seen 1 week 6 days ago. Offline
Joined: 1 Mar 2004
Posts: 5241
  • If I am planning a turnaround (the new word for shutdown) and I have 24 man-hours of Electrician required. The number of productive hours I get from an electrician in a day, say 6. How many electricians do I need that day?
  • Answer: Q = 24/6 = 4 electricians, a piece of cake, no Excel required.

More interesting than the fixed calculations is when you work on different shifts and each shift have different production rate.

Shifts sample schedule:

Activity 1A - 500 cm rock excavation Tams 1 and 2 working the activity on different shifts.
Team 1: 1ea Resource 1 with a production rate of 10 cm/hr and works Monday, Tuesday and Wednesday 10 hrs/day.
Team 2: 1ea Resource 2 with a production rate of 15 cm/hour and works on Wednesday, Thursday and Friday 10 hrs./day.

We have a single activity, two teams, two shifts, the production rate of each shift is different, therefore the duration of the activity will depend on what shifts end up performing the work.

If activity starts on Monday it will take ~ 3 days 3 hrs.
If activity starts on Wednesday it will take ~ 2 days 7 hrs.


Yes, David, since 1993 Spider does it out of the box planning resource quantities and resource hours separately and providing corresponding reports as was shown in my example.

I still don't understand how Excel can help.

Different resources may have different calendars and besides may work only on the part of their work hours. Very simple example: two resources units work together on some activity 50% of their work time, how to distinguish this case from one resource unit that is used 100%? Even peak work hours will show only 8 work hours per day but not if one resource unit with 100% workload or two resource units with 50% workload, or four resource units with 25% workload are required. Besides there are different shifts, etc. If this information is absent in the schedule what Excel can do?

Rafael Davila
User offline. Last seen 1 week 6 days ago. Offline
Joined: 1 Mar 2004
Posts: 5241

Spider Project will give you the maximum quantity of any given resource on the period you specify, [hourly,day, week, month, custom] it will also give you the total resource hours, it will dynamically adjust the activity duration if using individual resource production rate or a crew [multi-resource] production rate, the production rate can be a direct function of production resources or if not linear Skill on multi-resource will make it.

The following is a simple schedule where for some activities resource assignment and activity duration varies in accordance to available resources while for other activities this is not allowed.  Frequently it makes no sense to delay some activity because only 9 out of 10 resources are available, frequently it makes sense to start the activity with less resources [down to a specified minimum or minimal quantity] at a reduced rate and increase the production speed as more resources become available.

Easy, this is what any rookie PM will manually do if the scheduling tool does not helps.

For simplicity I am displaying the values of an histogram although I can also opt to display the chart, in some cases tabular reports will be better but for such simple case this should be enough.

 photo RESQ001_zpsgjerosgf.png

David Kelly
User offline. Last seen 2 years 24 weeks ago. Offline
Joined: 19 Oct 2004
Posts: 630

Much the same answer for Zoltan and Vladimir, just more words! 

This is such an important topic. P6 needs a bit of attention and serious understanding of its arithmetic


In my usual environments, Oil & Gas, Nuclear, Power & Utilities, of the three dimensions an activity estimate has (Duration, Number of men, and Estimated Total Manhours) the one that is calculated by the Estimate-and-Approval system is the total manhours. In my world a job is not a “three man job” or a “five day job” it is “76 manhours”. We almost never get any clue about required crew size.


In order to transform that number into Number of Men there are a lot of obstacles.


If I am planning a turnaround (the new word for shutdown) and I have 24 manhours of Electrician required between 00:00 and 01:00;


How many electricians do I need that day? If I divide the number of electrical hours I have to do that day (24) by the number of productive hours I get from an electrician in a day, say 6, my answer is way wrong. The old P3 setting for “peak” rather than “average” aggregation over any time period is still sorely missed in the P6 world. In fairness, not much else is.


But I have another problem in my world of multiple trades on multiple resource calendars and multiple activity calendars. I want to know how many men in total every day.


The two fantastically quick pivots that P6 layouts do that produce a histogram or spreadsheet view of resource or cost quantities with respect to time have a couple of issues:


If my resource quantity is estimated work content expressed in “manhours” (almost always in my world for the last 40 years) P6 will divide that number by a constant if required. Before you dare make the assumption that you can pick a divisor that will convert manhours to men, you need to consider a lot of stuff.


  • Resources may have different working hours in the day

  • Some activities have different “degrees of difficulty”

  • More imaginative arithmetic would be nice. If I must have an electrician for only one quarter of a day’s effort, and an instrument fitter for a quarter of a day’s effort on the same day, that’s not half a breathing apparatus, its two. The whole “divisor” issue is fraught with stuff like this. A quarter of man is still a whole man. Doubtless Vladimir will explain how Spider does this out-of-the-box, with his usual incredulity that we can create schedules at all……


The limitation in P6 that you cannot print a layout that shows the resource histogram/”S” curve and the associated data range in a spreadsheet on the one piece of paper has made a lot of P6 users expert at pivoting the data into Excel to produce a chart that does exactly that. There are also filtering issues with P6’s stacked histogram that mean most of those are excel pivot sourced.


Using the P6 tabular report writer you can effectively press one button and pivot not just the resource quantities, but activity coding information and resource user defined fields that can help or even completely overturn the “divisor” problem using Excel macros. I think this is the way to do it.


Now you could argue (cue Vladimir) that P6 should do this arithmetic for you. But since we have to pivot the data to Excel to deal with those old P6 Chestnuts – no % complete on the “Y” axis, no data range table under the graph – we might as well capture the data and do the math in Excel to get the “number of men” (number of permits, number of breathing apparatus and so on…) issue more accurate.

This problem was also discussed here: http://www.planningplanet.com/forums/oracle-primavera-pm6/593127/how-dis...

David, resource calendars do not provide sufficient information when resources are used part time.

David Kelly
User offline. Last seen 2 years 24 weeks ago. Offline
Joined: 19 Oct 2004
Posts: 630

OOOOOOO Zoltan, I don't Agree!


Both the resource spreadsheet and Resource Profile (histogram) allow all of the aggregated hours or cost to be divided.

BUT

Only one divisor per layout is allowed. This can either be a number that you type in, OR the default number of hours per time period from the "Admin Preferences" pull down.

It does not allow each resource's aggregated hours or cost to be divided by the resource's calendar. Or indeed anything else that is resource or activity dependent.

For example. I employ electricians offshore. They are being paid for 12 hours each day, seven days a week. If they are working on the main platform, each electrician can do 7 productive hours per day. If they are working on a satellite platform, they can only do 4 productive hours per day.

The onshore electrical engineer is paid for 8 hours per day, but I only get 6 hours actual work.

How do you pick a "number of men" divisor from that?


My choice is to pivot the data into excel, but include not just the resource ID, but the resource calendar or a User Defined Field that will trigger a resource-specific divisor for Excel, which can then plot the histogram.


zahid shaikh
User offline. Last seen 5 years 45 weeks ago. Offline
Joined: 24 Aug 2016
Posts: 35

It does ? Can you send Screen shot or tell the process how

Zoltan Palffy
User offline. Last seen 10 weeks 5 days ago. Offline
Joined: 13 Jul 2009
Posts: 3089
Groups: None

Vald

P6 can calcualte the number of men by dividing the manhours per that time period by the planned number of hours for that day, week, month, or year.

To say that p6 can does not claculate the number of men is WRONG it can do it. YOU just choose not to use it. 

P6 does not calculate the number of men, it calculates the number of manhours.

Zoltan Palffy
User offline. Last seen 10 weeks 5 days ago. Offline
Joined: 13 Jul 2009
Posts: 3089
Groups: None

no but if you click on the histogram a box will pop up with the vale 

Zoltan Palffy
User offline. Last seen 10 weeks 5 days ago. Offline
Joined: 13 Jul 2009
Posts: 3089
Groups: None

no but if you click on the histogram a box will pop up with the vale