Hi,
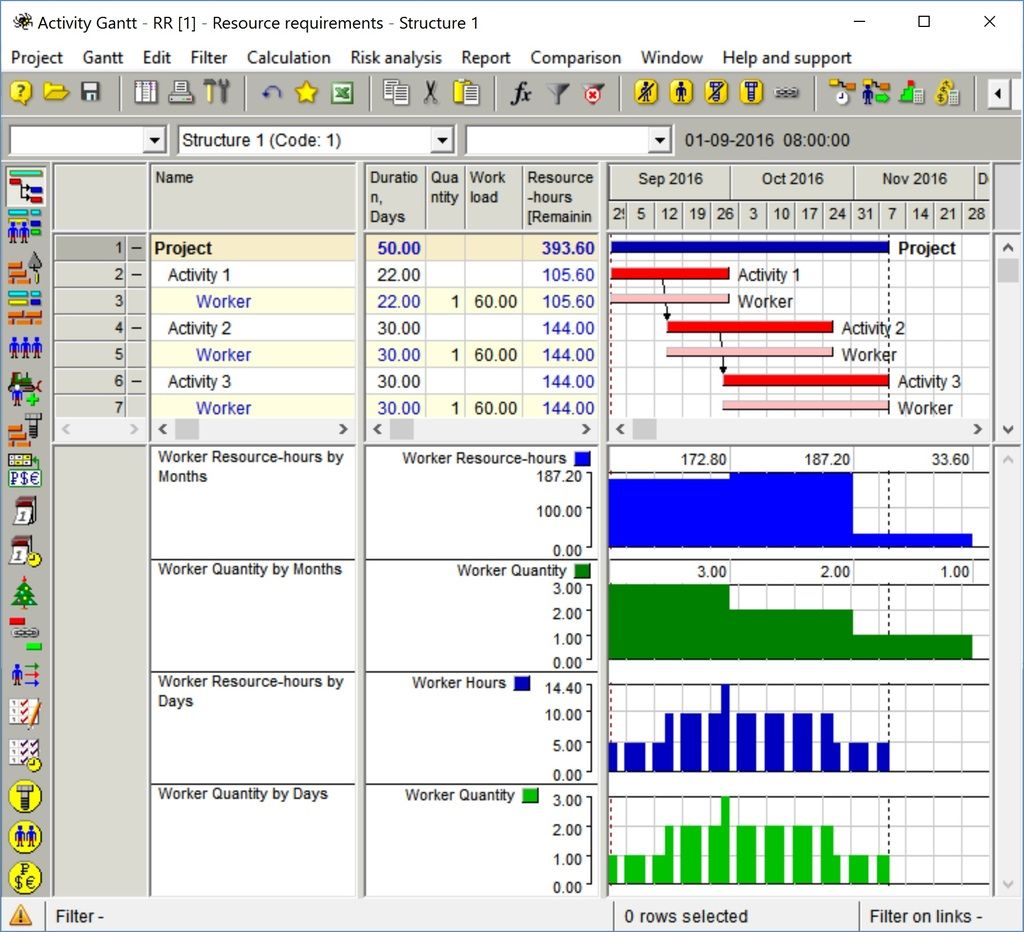
In the Resource Usage Profile I am trying to display the histogram by Month with the number of men shown down the left hand side rather than the hours for the month.
I display the columns by Month by setting the Timescale to Quarter/Month.
I then need to enter a figure for hours per time period in the "Divide intervals totals by" box in the Graph tab of the Resource Usage Profile Options dialogue box.
This is where I have a problem. If I set up for weeks it works fine. I display the columns by week and enter 65 into the "Divide interval totals by" box (we work 65 hours a week). This works. But when I try to do it by month I have a problem. The months have differing numbers of days, so what figure do I enter?
Also, what does the "Unit of Measure" box do? I have tried entering W, M , Hr. Nothing seems to make any difference.
Thanks very much


Replies