Guild of Project Controls: Compendium | Roles | Assessment | Certifications | Membership

Tips on using this forum..

(1) Explain your problem, don't simply post "This isn't working". What were you doing when you faced the problem? What have you tried to resolve - did you look for a solution using "Search" ? Has it happened just once or several times?

(2) It's also good to get feedback when a solution is found, return to the original post to explain how it was resolved so that more people can also use the results.
S curve Formula

14 replies [Last post]
bryc ali
User offline. Last seen 1 year 41 weeks ago. Offline
Joined: 3 Nov 2009
Posts: 43

During my experience in few company, I found a kind of table to draw our s-curve, you can choose a number of period and you have the forcast corresponding of this period, the periode can be (hour, day, week or month), for exemple :

Number of period 4 / period( 1) 13.20% / period( 2) 27.50% / period(3) 36.40% / period(4)  22.90%

With this value you can draw your s-curve, DO you have any information about it ? or the function that you can insert only the number of period and you have the percent that you mus achieve in each period ?

Replies

Angelito Estrella
User offline. Last seen 1 year 17 weeks ago. Offline

excell functions

norm.dist

stdev.s


gives bell shape curve

Anoon Iimos
User offline. Last seen 2 years 27 weeks ago. Offline
Joined: 22 Sep 2006
Posts: 1422
You have to consider that there are several types of curves in a certain schedule. At least: Early Curve; Late Curve (based on planned data) and Actual Curve. The Data Date determines where you are at a certain time. And ideally, all data at the left of the data date should be actuals, and everything on the right shall be planned. Of course your calculations shall be based on cumulative weighted percentage that boils down to 100% whether based or using Quantities or Currencies. Each WBS level should have corresponding weight percent as well, which shall come down to 100% with the sum product of activities under it. And the total of all WBS should also come down to 100% which shall represent the whole project. I hope this clears the confusion.
Rafael Davila
User offline. Last seen 2 weeks 3 days ago. Offline
Joined: 1 Mar 2004
Posts: 5230

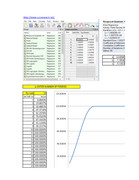
You can use Curve Fitting Software to get a formula that fits your scurve shape.

Scurve-Fittingjpg-Page1

Then using Excel you can make use of the formula to get the numbers.

http://www.mediafire.com/file/vd0at7qvc10cp9z/Scurve_Fitting.xlsx/file

Good Luck

bryc ali
User offline. Last seen 1 year 41 weeks ago. Offline
Joined: 3 Nov 2009
Posts: 43

What about C1 and C2 ?

Nelson A. Rodriguez
User offline. Last seen 5 years 1 week ago. Offline
Joined: 25 Mar 2008
Posts: 8
You can use a theoretical S curve equation like: Y = X / ( X + Exp(C1-C2*X) ) Where C1 and C2 are the parameters to control both: whether the curve is front or back loaded, and the level of knowledge the executor has about the project's subject.
bryc ali
User offline. Last seen 1 year 41 weeks ago. Offline
Joined: 3 Nov 2009
Posts: 43

I know that but i want to determinate de fonction that gives me the percent function of the number of period ? to draw the s-curve you see ?

Zoltan Palffy
User offline. Last seen 16 weeks 6 days ago. Offline
Joined: 13 Jul 2009
Posts: 3089
Groups: None

activity #1 month #1 = 1320 hours

activity #2 month #2 = 2750 hours

activity #3 month #3 = 3640 hours

actviity #4 month #4 = 2290 hours

bryc ali
User offline. Last seen 1 year 41 weeks ago. Offline
Joined: 3 Nov 2009
Posts: 43

Sorry for the confusion, I will try to explain, for exemple I have to achive a Task in 4 month with a Manhours of 10000 hours, 

Number of period 4 / period( 1) 13.20% / period( 2) 27.50% / period(3) 36.40% / period(4)  22.90% it means:

The first month my progress need to be 13.20% or 1320 hours and the second month 27.50% it means 2750 hours in period and 4070 hours cumulative .... you see ?

Hiyour calculation period looks like a fiscal year Method, it contains 4 No. Of Quarters in the fiscal year. According to Fiscal year forecast, the assigned period calculation is the achievement of each quarter of the fiscal year. master schedule holds the complete plan of the fiscal year achievement.
Anoon Iimos
User offline. Last seen 2 years 27 weeks ago. Offline
Joined: 22 Sep 2006
Posts: 1422
It is just linear. For example: X and Y axis or Columns and Rows. Where Columns represent Time or Period (Constants) and Rows represent Scope (or Variables) with corresponding Units, Quantities and Costs (as perhaps you have seen in your BOQ). You simply equate Scope with Time and that's all (period).
Zoltan Palffy
User offline. Last seen 16 weeks 6 days ago. Offline
Joined: 13 Jul 2009
Posts: 3089
Groups: None

percent progress of what ? what is your measuing stick ?

so are you saying for example that you have 100 activities and 50 of them are done then you are 50% complete ?

each activity does not have athe same weighted value in terms of dollars, manhours, commodity units or even duration so you can use that.

Raymund de Laza
User offline. Last seen 4 weeks 3 days ago. Offline
Joined: 23 Nov 2009
Posts: 762

As Zoltan says, Cost loaded Schedule will generate the near realistic Forecast and S-Curve.

Otherwise, your Target is Nowhere.

bryc ali
User offline. Last seen 1 year 41 weeks ago. Offline
Joined: 3 Nov 2009
Posts: 43

It's mesured forcast percent of progress

Zoltan Palffy
User offline. Last seen 16 weeks 6 days ago. Offline
Joined: 13 Jul 2009
Posts: 3089
Groups: None

you have not mentioned what the curved is measuing what is the measuing stick ?

why do that  ? why not cost load or manhour load each actvity and let the program draw the curve for you  ?