Website Upgrade Incoming - we're working on a new look (and speed!) standby while we deliver the project

Tips on using this forum..

(1) Explain your problem, don't simply post "This isn't working". What were you doing when you faced the problem? What have you tried to resolve - did you look for a solution using "Search" ? Has it happened just once or several times?

(2) It's also good to get feedback when a solution is found, return to the original post to explain how it was resolved so that more people can also use the results.

Resource Assignment

5 replies [Last post]
Michael Petzer
User offline. Last seen 3 years 32 weeks ago. Offline
Joined: 29 Apr 2021
Posts: 5
Groups: None

Hi All,

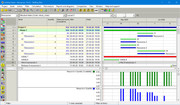
Need to report 'resource limit' allocated to activities and show on a spread sheet or report. I set up the resources limits as per below, the 'resource usage spreadsheet' still shows the default 8h/d. There are multiple resources (diffrent set limits) allocated to one activity, all showing 8h/d.

Ive tried changing between calendars (resource project), changed settings to set default to 4h/d. Same result as above on the resource and activity spreadsheets.

wysiwyg_imageupload::

7729
1.jpg

7730
2.jpg

Replies

Zoltan Palffy
User offline. Last seen 9 weeks 1 day ago. Offline
Joined: 13 Jul 2009
Posts: 3089
Groups: None

glad we could help 

Michael Petzer
User offline. Last seen 3 years 32 weeks ago. Offline
Joined: 29 Apr 2021
Posts: 5
Groups: None

Thanks Gents, appreciate the input........

Rafael Davila
User offline. Last seen 1 day 19 hours ago. Offline
Joined: 1 Mar 2004
Posts: 5241

For reporting purposes a split screen view is not always good enough, in such case a Gantt Report that shows resource allocation along with fields of interest may have no match. Scheduling is mostly about logic, volume of work, teams and their production rates, a good report should disclose these parameters and their values. In this case no activity with predecessor means there are no links among the activities.

Activity-Gantt-Shifts-01-1-Shifts-Seasons-Earthworkjpg-Page1

click the thumbnail and zoom for a better view.

On the other hand table reports are better at showing time distributed data.

Diagrams are also good to show resource usage vs availability.

2021-05-02-18-57-30

But sometimes this is not enough to understand how we model changes in availability of resources, here resource production reports will give us the clue. Instead of using fixed dates we used activities to increase or decrease resource availability.

2021-05-02-18-56-30

These are just some examples you shall be able to mimic using your software.

Good luck.

Zoltan Palffy
User offline. Last seen 9 weeks 1 day ago. Offline
Joined: 13 Jul 2009
Posts: 3089
Groups: None

if you go to view layouts selet no whne it ask you if you want to save the lapout and look for the canned layout called Resource Overallocation Profile

or view show on bottom resource usage profile and under that data tab at the bottom under Additional Data Options check select limit and check Show Overallocation

on the left you and sleect a particualr resource to see if you are over the limit


David Kelly
User offline. Last seen 2 years 22 weeks ago. Offline
Joined: 19 Oct 2004
Posts: 630
You need to use the 'Resource Spreadsheet' view, with the filter set to' all projects'. Since resource avaiability is established across all projects, you cannot see 'limit' when the filter is set to 'open projects only'