Hello everyone,
I come from a background in architecture, but have now found myself working with a contractor - where I have been tasked with developing ways of visualising progress using BIM/Navisworks.
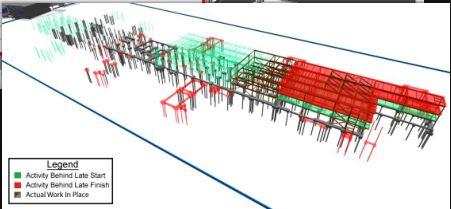
I am starting off with some very basic visual reports, which will hopefully become more sophisticated.I came across an 'Autodesk University' presentation by Swinerton, where they showed an interesting image, where model elements behind their 'Late Start', and 'Late Finish' dates were highlighted (below):
I understand why highlighting the activities behind 'Late Start' can be useful for Project Controls - If we don't take mitigation measures, and increase performance in these activities, the project finish date will be compromised... we have a chance to finish before the late finish date.
What is the real purpose in highlighting activities that are behind their 'Late Finish' date though? These are already critically behind and have pushed the schedule back. Are we highlighting red here, because project controls are going to have to mitigate on these activities, and future activities in order to recover the schedule?
Any help input would be much appreciated - hope to be getting more active on these forums! Cheers


Replies