How does Progress Line in Primavera P6 work?
Primavera provide a tool called Progress Line to compare Actual Progress (Activity % Complete) with Baseline on Gantt chart.
I will show you how to do it.
We have a simple project. It is assigned a Project Baseline.
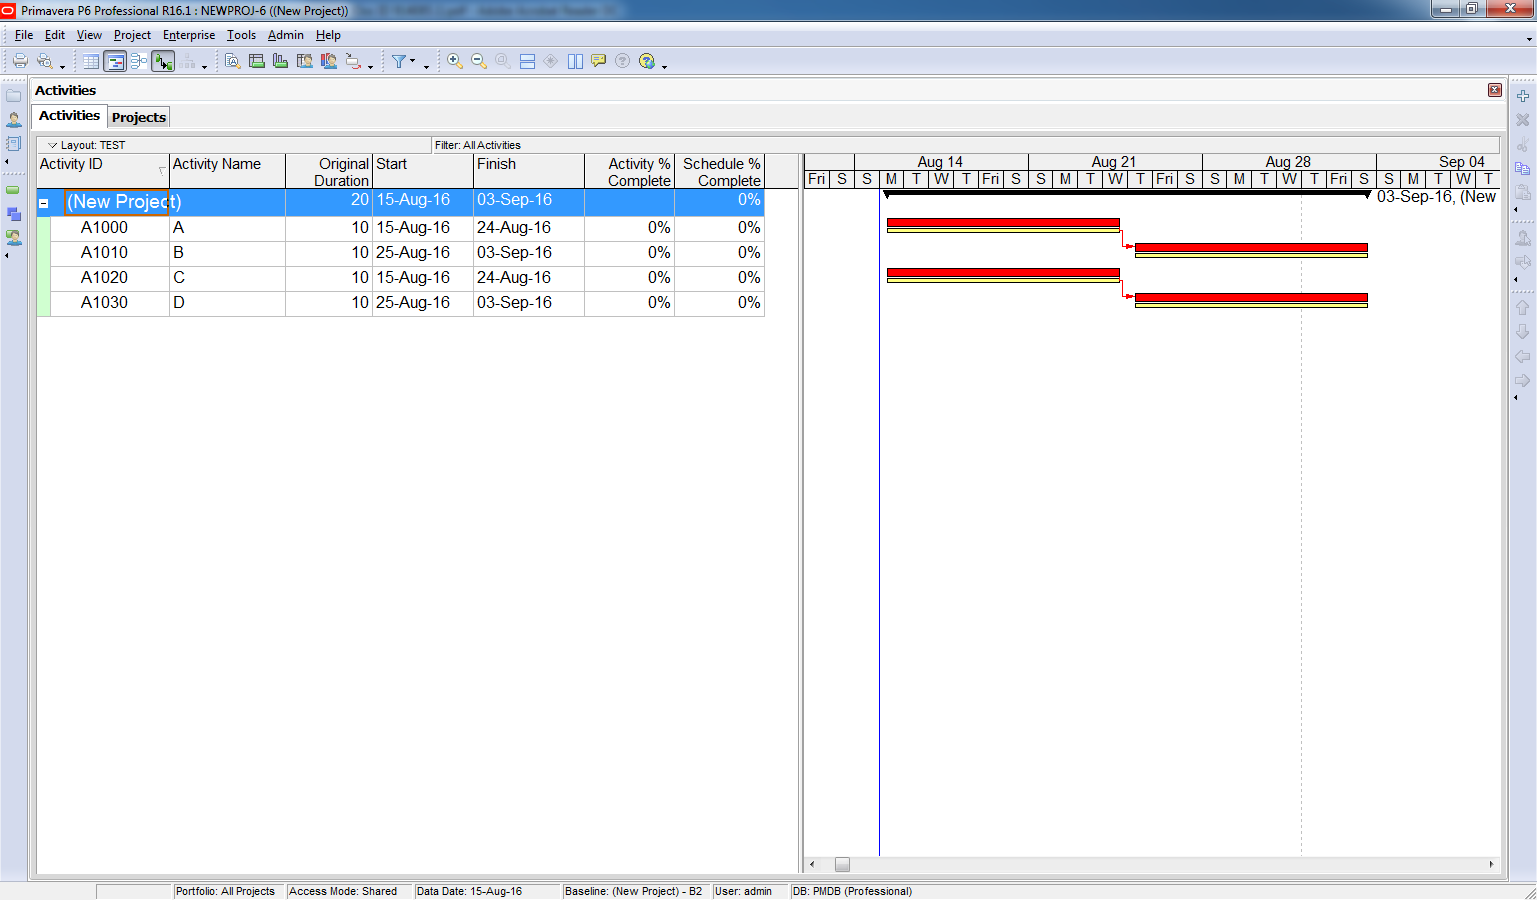
Then we will update the project.
Activity A finish 2 days late so Activity B start late and now is behind schedule.
Activity C finish 2 days early so Activity D start early and now is ahead schedule.
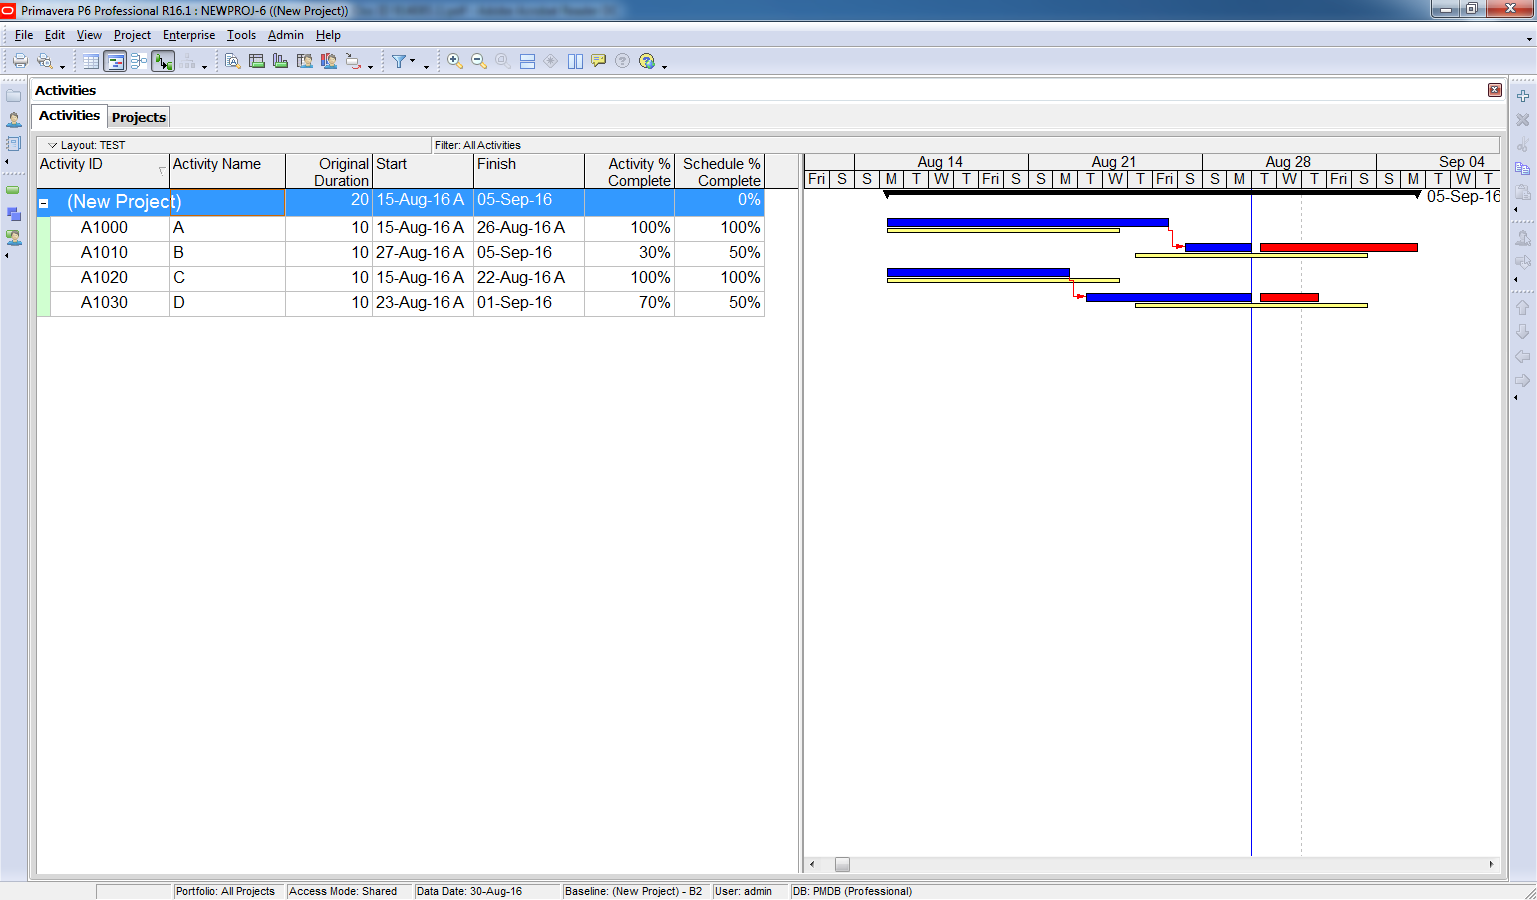
Now we want to see the current progress in compare with baseline.
We can right click on Gantt chart -> Bar chart option.
Go to Progress Line tab -> Select “By connecting progress points based on activity’s” and “Percent Complete”
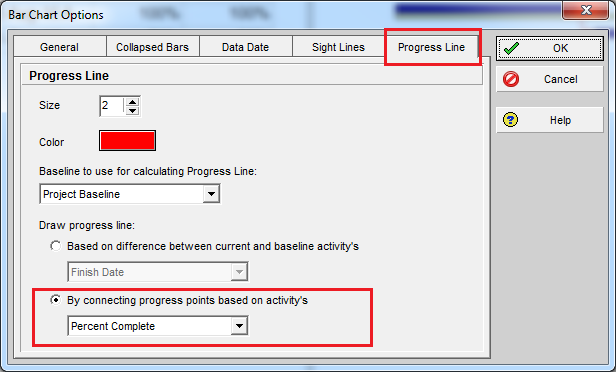
Click OK. Go to menu View -> Progress Line.

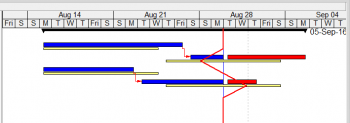
Now Primavera will show a vertical red line.
The line will go left if the activity is behind schedule.
The line will go right if the activity is ahead schedule.

The point (where the red line connect) represent the Activity % Complete. But now it show on Baseline bar so that we know the activity is late or early.
Activity B is 30% complete, then the progress line will be drawn 30% of the way along the baseline bar.
Activity D is 70% complete, then the progress line will be drawn 70% of the way along the baseline bar.
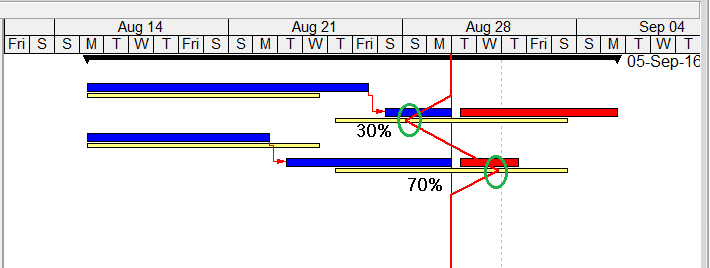
So now by display the Progress Line we can quickly see which activity is behind schedule and which activity is ahead schedule.
Note :
Normally the Progress line is only used to analyze on-going activity. It will be drawn at same place with Data Date if:
- The activity is a Milestone.
- The activity does not exist in the baseline.
- The activity is completed.
- The activity is not started, and the baseline start is after or on the Data Date
How about “Remaining Duration” option

If you select the ‘Remaining Duration’ option, then the progress point will be calculated as:
Progress Point = Baseline Finish – Remaining Duration.

Progress point of Activity B = 03/Sep – 7 day = 28/Aug
Progress point of Activity D = 03/Sep – 3 day = 01/Sep
With this option we can also quickly see which activity is behind schedule and which activity is ahead schedule.
Thank you for your time to read this article.
You can also find other post at my personal blog : https://doduykhuong.wordpress.com/
 Printer-friendly version
- Login or register to post comments
 Send to friend
Comments
Thank you :-)
Thank you :-)
amazing
amazing